








Quick Summary
- Enterprise BI differs from traditional BI in scope and governance, serving thousands of users on real-time data rather than scheduled reports for one central analyst team.
- Four capability groups define a platform: the data foundation, delivery and visualization, intelligence such as self-service and prediction, and control through governance and performance management.
- Certify 5 to 10 core metrics in a semantic layer rather than hundreds, because attempting to define everything at once is what stalls the programme.
- Maturity runs from descriptive through diagnostic and predictive to prescriptive, and each step should prove its value before the next one begins.
- Adoption failures are behavioural rather than technical, so track weekly active business users and certified-metric coverage alongside cost, since an idle tool returns less than nothing.
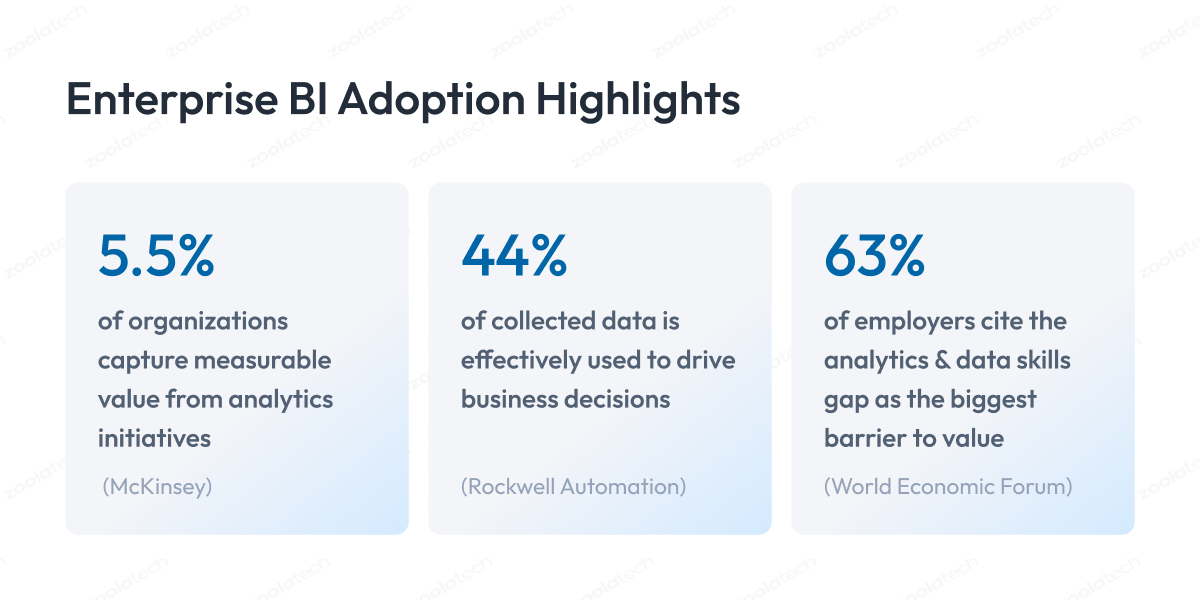
Enterprise business intelligence is now core to how large firms compete. Leaders rarely lack data. They lack insight from complex data, on time. Enterprise BI closes that gap with software and governance. It integrates data sources and centralizes business data. The result is a complete view of the business.
What Is Enterprise Business Intelligence?
Enterprise business intelligence is an organization-wide system for decisions. It collects, integrates, analyzes, and presents business data. It serves thousands of business users at once.
The aim is consistent, trusted insight. That insight supports business decisions at every level. It reaches across the enterprise, not one team.
Enterprise BI does several core things at scale:
- Integrate many data sources
- Centralize and govern business data
- Analyze data for trends and patterns
- Deliver insight through dashboards
- Support data-driven decisions
Enterprise BI vs traditional BI
Traditional BI built scheduled reports for a few analysts. Enterprise BI serves the whole business in real time. The scope is far larger. The governance is far stricter. The reach extends across departments.
| Dimension | Traditional BI | Enterprise BI |
| Users | Central analyst team | Thousands across departments |
| Scope | Scheduled reports | Real-time data and analytics |
| Data sources | One data warehouse | Many integrated data sources |
| Governance | Light | Strong data governance |
| Outcome | Backward reports | Data-driven decisions |
How enterprise BI has moved on
Enterprise BI has moved beyond static reporting. Modern BI adds self-service and real-time data. It adds AI and natural language. Enterprise BI gives leaders insight, not just numbers. It supports an agile business that acts fast.
- Self-service for business users
- Real-time data and alerts
- Predictive and prescriptive analytics
- Natural language questions
Enterprise BI vs ERP and other systems
Enterprise BI is not enterprise resource planning. ERP runs operations and transactions. Enterprise BI analyzes the data those systems create. A separate BI tool serves one team only. Enterprise BI unifies analysis across the enterprise.
| System | Primary role | Relationship to BI |
| ERP | Run core operations | Feeds data into BI |
| CRM | Manage customers | Feeds data into BI |
| Enterprise BI | Analyze and report | Unifies all the data |
Core BI Capabilities of an Enterprise Business Intelligence Platform
A modern enterprise business intelligence platform is defined by its BI capabilities. These capabilities decide whether it scales. They also decide whether users trust the output.
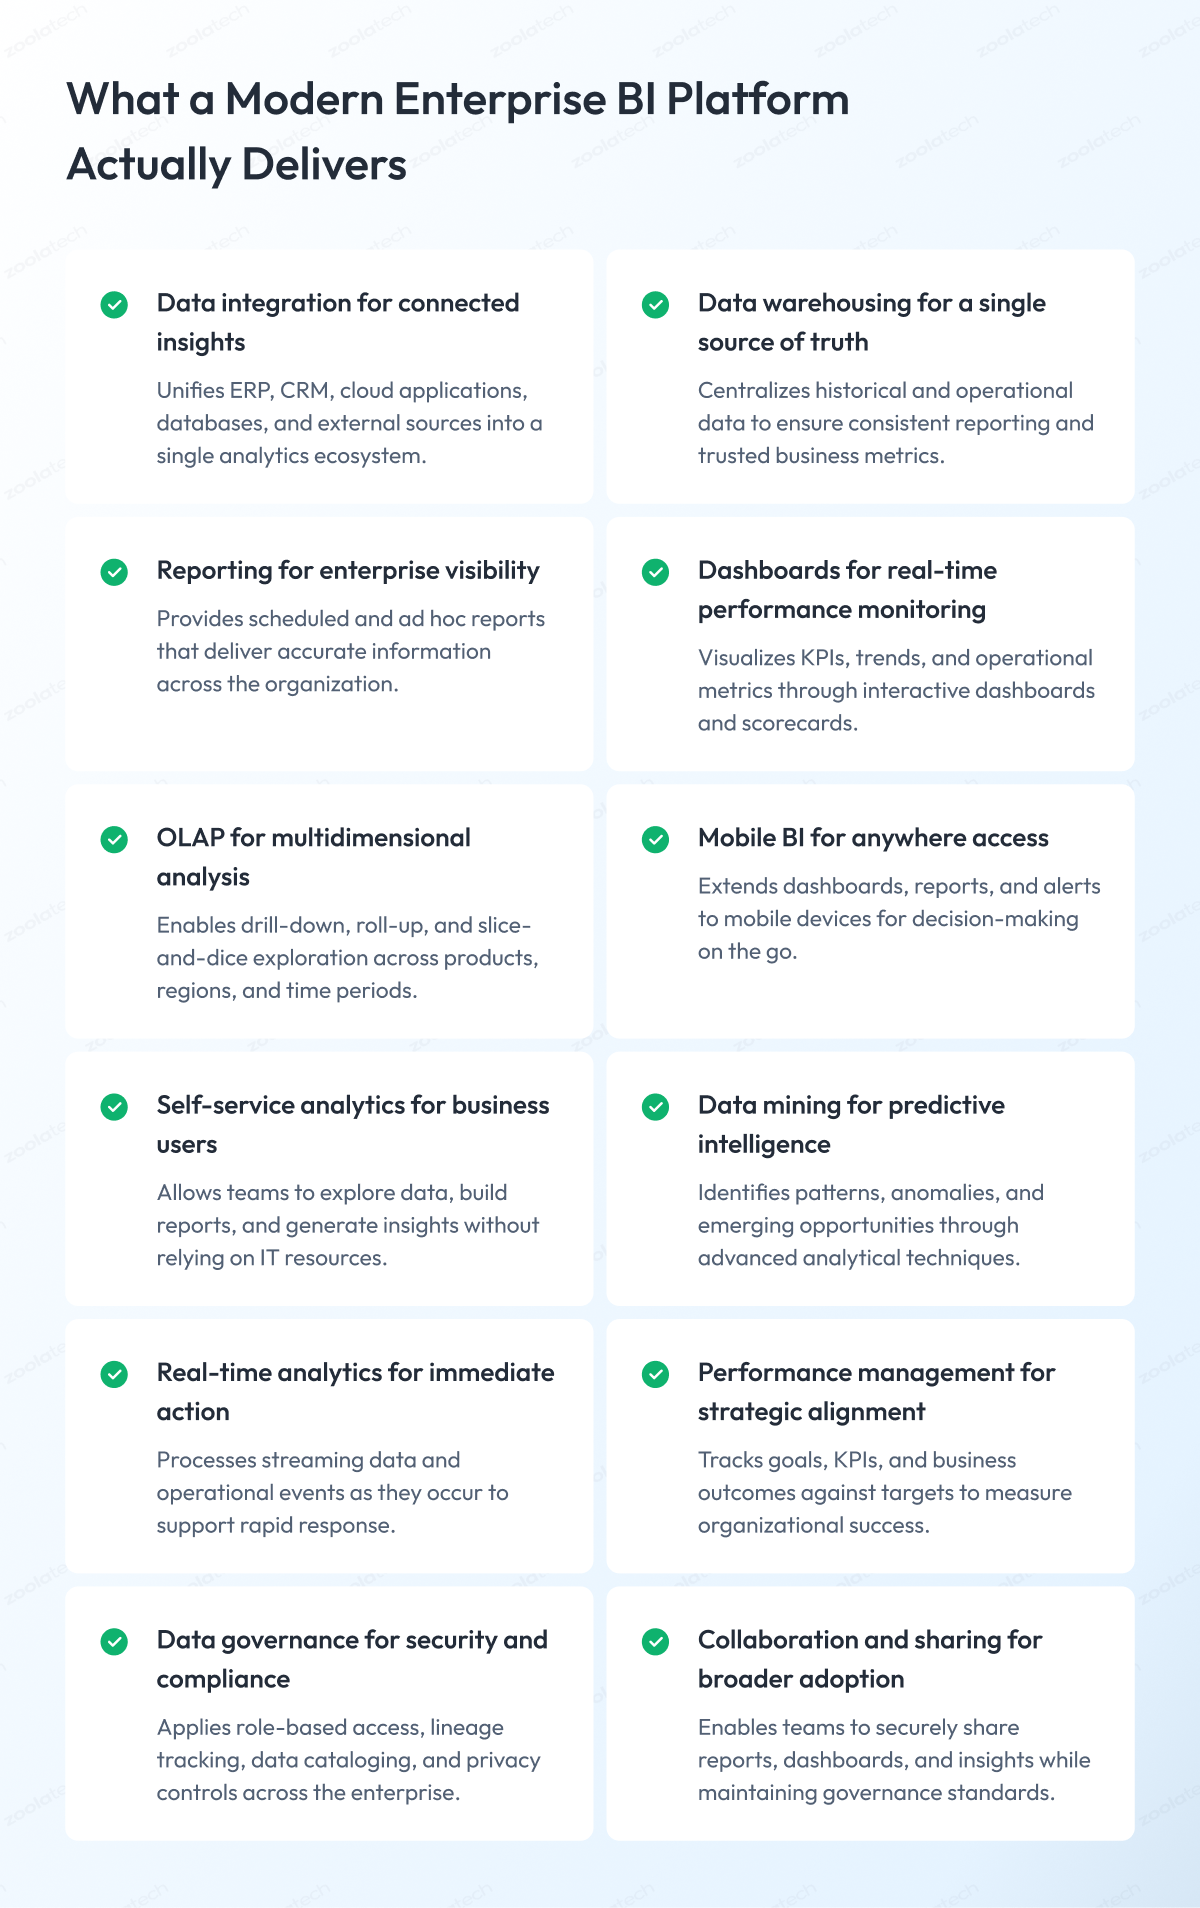
| Capability group | Includes | Enterprise value |
| Data foundation | Integration, warehousing | One trusted source |
| Delivery | Reporting, dashboards, OLAP, mobile | Fast, governed access |
| Intelligence | Self-service, mining, real time | Proactive decisions |
| Control | Performance, governance, sharing | Trust and accountability |
1. Data foundation capabilities
Data foundation capabilities create the trusted data layer that every enterprise BI platform depends on. They integrate information from multiple systems, standardize it, and store it in a governed environment so every team works from consistent, reliable data.
1.1. Data integration
Enterprise BI integrates data from many systems. It connects ERP, CRM, cloud apps, and files. It uses ETL, ELT, and APIs to move data. It can capture changes in near real time. Strong integration removes manual stitching. It creates one unified view of the business.
- ERP and CRM systems
- Cloud and SaaS applications
- Databases and spreadsheets
- External and partner data
1.2. Data warehousing
A central data warehouse stores historical and current data. Many firms now use a cloud data warehouse or lakehouse. This keeps reporting consistent across the enterprise. Centralized storage means one version of the truth. Every team works from the same numbers. It also simplifies governance and audit.
- Centralized, governed storage
- Historical and current records
- One trusted reporting base
2. Delivery and visualization capabilities
Delivery and visualization capabilities turn governed data into actionable insight. They provide business users with reports, dashboards, and interactive analysis that make information accessible, understandable, and useful for day-to-day decision-making.
2.1. Reporting
Enterprise BI produces scheduled and ad hoc reports. Business users reach accurate data fast. Reports can be operational, financial, or regulatory. Good reporting cuts long queues and rework. It reduces conflicting versions of the truth.
- Scheduled operational reports
- Ad hoc self-service reports
- Compliance and audit reports
2.2. Dashboards and visualization
Interactive dashboards present KPIs and business metrics. Good data visualization turns complex data into insight. Leaders monitor business performance live. Drill-through lets users explore the detail. Clear visualization speeds informed decisions.
- Executive KPI dashboards
- Interactive charts and scorecards
- Drill-through visual reports
2.3. Online analytical processing (OLAP)
OLAP enables multidimensional data analysis. Users drill down, roll up, and slice data. They view metrics by product, region, or time. This supports deeper data analysis than charts alone. It answers questions reports cannot anticipate.
- Drill-down and roll-up
- Slice-and-dice analysis
- Reusable data models
2.4. Mobile BI
Mobile BI delivers dashboards to phones and tablets. Leaders decide anywhere, at any time. Field teams act on the same numbers. Push alerts flag issues early. Distributed teams stay close to insight.
- Mobile dashboards
- Push alerts and notifications
- Secure offline access
3. Intelligence capabilities
Intelligence capabilities move enterprise BI beyond reporting. They combine self-service analytics, advanced analysis, and real-time processing to uncover trends, predict outcomes, and help organizations respond faster to changing business conditions.
3.1. Self-service analytics
A self-service BI platform lets business users build reports. It reduces reliance on IT teams. It speeds decision-making across departments. Governance keeps that freedom safe. It protects analytics value that can otherwise plateau.
- Governed self-service access
- Guided data exploration
- Approved, certified content
3.2. Data mining and advanced analytics
Advanced analytics finds patterns in business data. It identifies trends and relationships. It powers predictive and prescriptive analysis. It points to growth opportunities early. Enterprise BI helps teams act before rivals.
- Predictive forecasting
- Anomaly detection
- Prescriptive recommendations
3.3. Real-time analytics
Real-time analytics processes data as it arrives. Teams react fast to change. This is vital in supply chain and fraud. It is helped by rising enterprise AI adoption. Real-time data turns BI into a live signal.
- Sub-minute data processing
- Live operational alerts
- Streaming event analytics
4. Control capabilities
Control capabilities ensure enterprise BI remains trusted as adoption grows. They establish governance, monitor performance, protect sensitive data, and enable secure collaboration so analytics can scale without sacrificing quality or compliance.
4.1. Performance management
Enterprise BI helps track goals and KPIs. It supports balanced scorecards. It links daily work to strategy. Managers see variance against targets. This strengthens business management.
- Balanced scorecards
- Goal and KPI tracking
- Variance monitoring
4.2. Data governance and security
Data governance protects quality, privacy, and compliance. It is anchored by a formal governance framework. Access follows roles and permissions. Masking protects sensitive business data. Governance matters as breach costs keep rising.
- Role-based access control
- Data catalog and lineage
- Masking and encryption
4.3. Collaboration and sharing
Teams share reports and dashboards across departments. Collaboration spreads data-driven decisions. Comments keep context with the data. BI tools can also embed analytics into daily apps. Sharing stays governed and secure.
- Shared analytics workspaces
- Comments and annotations
- Governed distribution
Data Sources That Enterprise BI Connects
Enterprise BI is only as good as its inputs.
- It pulls from many data sources at once.
- It must integrate structured and unstructured data.
- It should handle batch and real-time data.
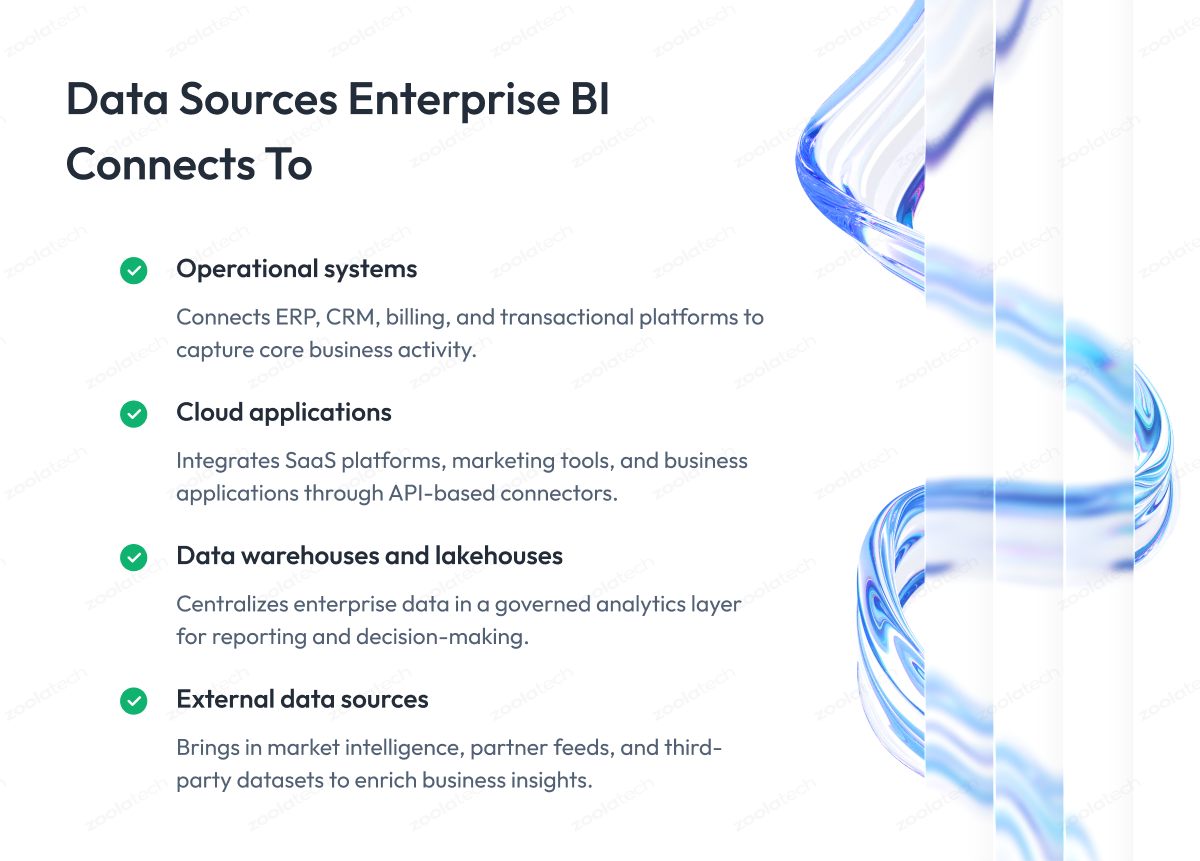
| Data source | Examples | Notes |
| Operational systems | ERP, CRM, billing | Core transaction data |
| Cloud applications | SaaS, marketing tools | API-based connectors |
| Data stores | Data warehouse, lakehouse | Central analytics layer |
| External data | Market, partner feeds | Adds context |
Modern Enterprise BI Platforms: Architecture and Software
Modern enterprise BI platforms run on cloud architecture. That architecture decides whether BI capabilities scale. A semantic layer keeps definitions consistent. This matters because a shared semantic layer creates one source of truth.
Cloud-native foundations
Cloud platforms scale compute and storage on demand. Hybrid designs balance control and cost. They also handle data locality rules. This supports the deployment of BI at scale. It shortens time to new analytics.
- Elastic compute and storage
- Hybrid and multi-cloud options
- Faster delivery of analytics
Data fabric and data mesh
A data fabric unifies access across environments. A data mesh gives domains data ownership. Both reduce silos across the enterprise. Both rely on shared governance. They suit large, complex estates.
- Data fabric: automated discovery, cataloging, and a shared semantic layer keep data consistent.
- Data mesh: domain teams own data products under federated governance.
Automation and infrastructure as code
Infrastructure as code makes BI environments repeatable. Automated pipelines cut errors. They reduce manual effort. This keeps modern BI reliable at scale. It matters as firms rethink their operating model.
- Version-controlled environments
- Automated testing and deployment
- Continuous data-quality checks
Generative AI and natural language
AI brings conversational analytics to BI. Users ask questions in plain words. The platform returns governed answers. Generated narratives explain the numbers. This widens access to insight.
- Natural language queries
- Automated insight generation
- Contextual data storytelling
Enterprise BI tools and software
Many business intelligence tools plug into this foundation. The list compares common enterprise BI tools. Names are for reference only. The right choice depends on your stack.
| BI tool | Type | Best known for |
| Microsoft Power BI | BI platform | Office integration, low cost |
| Tableau | BI platform | Strong data visualization |
| Qlik Sense | BI platform | Associative analytics engine |
| Looker | BI platform | Governed semantic modeling |
| Domo | Cloud BI | Cloud-native dashboards |
| ThoughtSpot | BI platform | Natural language search |
| SAP BusinessObjects | Enterprise BI | Large SAP estates |
| Oracle Analytics | Enterprise BI | Oracle data stacks |
A single Power BI deployment suits many teams. Larger estates often blend several BI tools. Governance should sit above the tool, not inside it.
Enterprise BI Deployment Models
The deployment of BI shapes cost, control, and speed. Each model fits a different enterprise need. The table compares the main options.
| Deployment model | Best fit | Trade-off |
| On-premises | Strict data residency | High maintenance, slow scaling |
| Cloud | Fast scaling, low upkeep | Ongoing subscription cost |
| Hybrid | Mixed control needs | More integration to manage |
| Embedded | Analytics inside other apps | Tighter engineering work |
On-premises
Some enterprises must keep data in-house. On-premises BI gives full control over data residency. It suits strict regulatory regimes. But it carries high maintenance and slow scaling.
- Full control over data residency
- Best fit for strict compliance
- Higher maintenance and cost
Cloud
Cloud is now the default for most enterprises. It scales fast and cuts maintenance. Capacity flexes with demand. Subscription cost is the main trade-off.
- Elastic capacity for peak loads
- Lower infrastructure overhead
- Ongoing subscription cost
Hybrid
Hybrid blends on-premises and cloud. It keeps sensitive data on-premises. It moves the rest to the cloud. This balances control and agility.
- Sensitive data stays on-premises
- Flexible data residency
- More integration to manage
Embedded
Embedded BI puts dashboards inside other apps. Business users never switch tools. Insight appears where work happens. This raises adoption and keeps governance central.
- Analytics inside core apps
- Fewer context switches
- Higher daily usage
Benefits of Enterprise BI for Business Performance
The benefits of enterprise BI show in business performance. Teams make faster, more informed decisions. They work from one trusted source. They stop arguing about whose numbers are right.
- Faster business decisions: governed dashboards shorten the path from question to answer.
- Lower risk: consistent metrics and governance reduce costly forecasting errors.
- Streamlined operations: automation and real-time data streamline business operations.
- Growth opportunities: sharper analysis reveals growth opportunities in pricing and retention.
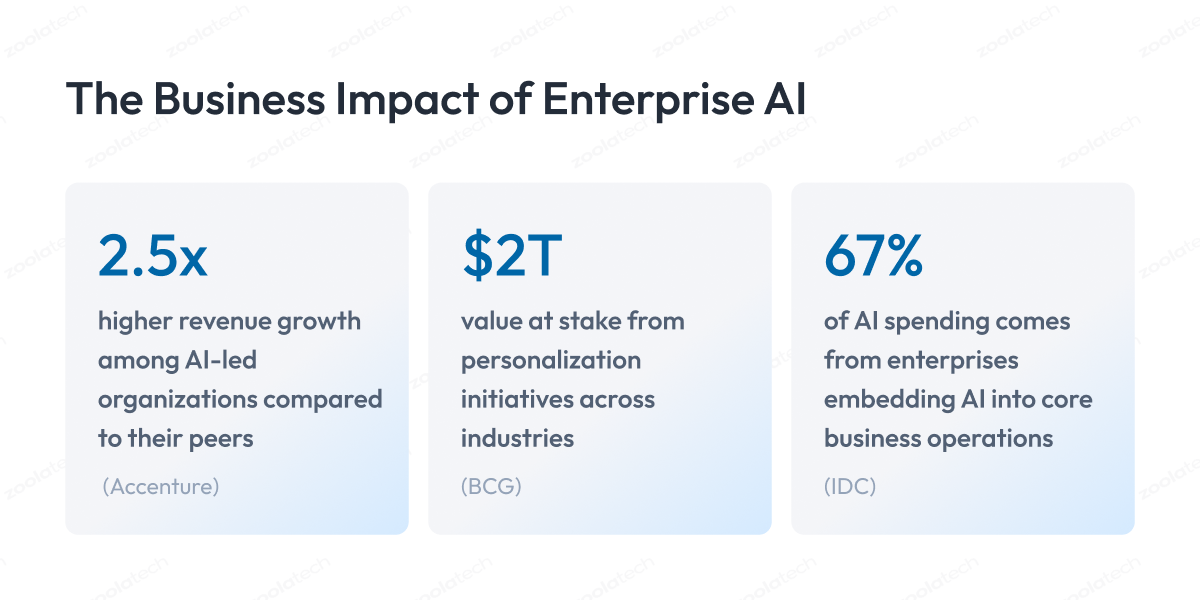
How enterprise BI gives leaders a complete view
Enterprise BI helps track performance against strategy. It connects every unit to shared business metrics. It supports stronger business management. It turns scattered reports into one view. That view spans the whole enterprise.
- One view across departments
- Consistent business metrics
- Early signals from predictive analytics
Self-Service BI Without Losing Governance
Self-service is the heart of modern BI. It lets business users answer their own questions. But ungoverned self-service breaks trust fast. The goal is freedom within clear limits. A self-service BI platform must balance both.
Guardrails and certified content
Guardrails define who can query which data. Certified dashboards carry a trust label. Users know which numbers are official. This prevents conflicting, unsafe reports. It keeps self-service from creating new silos.
- Policy-based access rules
- Certified, official dashboards
- Clear data ownership
Data literacy and enablement
Self-service only works with skilled users. Data literacy turns access into value. Training builds confident, daily habits. Champions support their own teams. Adoption rises across departments.
- Role-based training paths
- Internal data champions
- Simple, guided templates
Securing Sensitive Business Data in Enterprise BI
Enterprise BI touches sensitive business data daily. Security must be built in, not bolted on. Access control limits exposure. Encryption protects data in transit and at rest. Strong security also supports compliance.
Access control and identity
Role-based access control follows data sensitivity. Users see only what their role allows. Identity management ties access to people. Reviews remove stale permissions. This reduces the blast radius of any breach.
- Role-based access control
- Identity and access management
- Regular access reviews
Compliance and audit
Compliance rules vary by industry and region. Enterprise BI must support audit trails. Lineage shows where each number came from. Masking hides regulated fields. This keeps the business audit-ready.
- Audit trails and lineage
- Field-level masking
- Regional compliance controls
Common Challenges in Enterprise BI Adoption
The common challenges in enterprise BI are rarely technical. The challenges in enterprise BI adoption sit in people and process. They appear in three patterns. Each one stalls value. Each one is fixable with discipline.
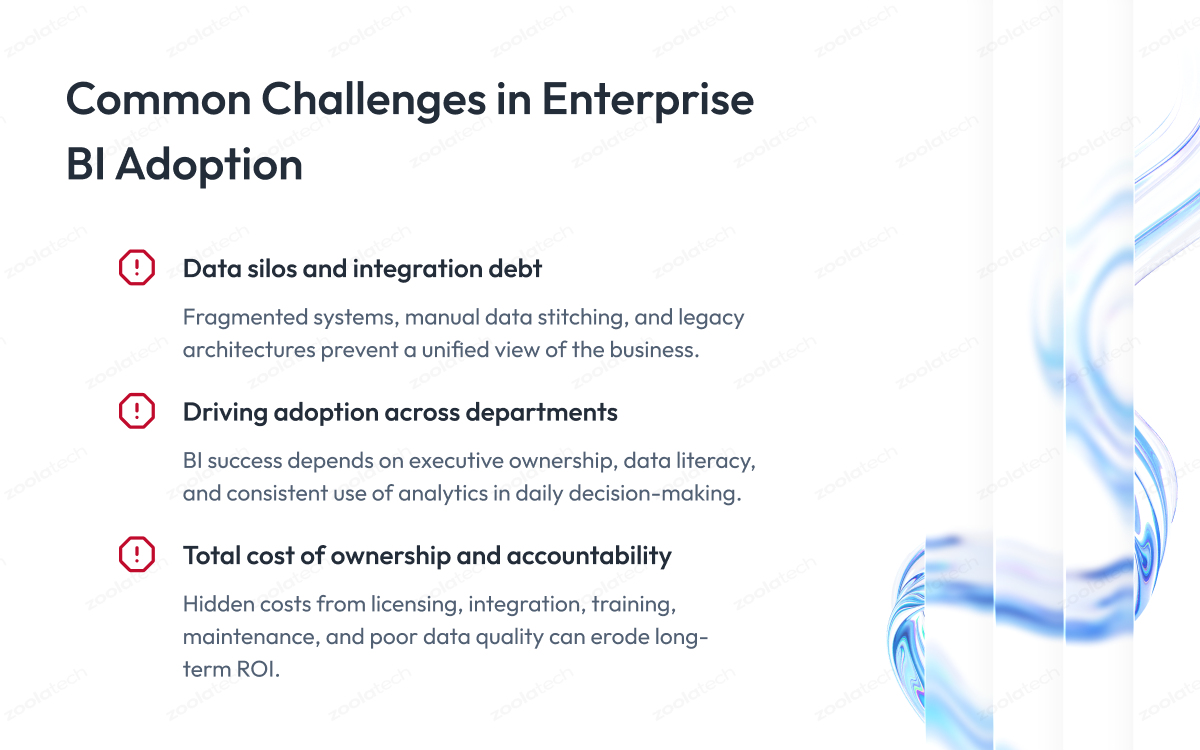
1. Data silos and integration debt
Fragmented systems scatter business data. Integration debt blocks a single view of the business. Manual stitching slows every report. Legacy modernization removes that debt. Clean integration restores trust.
- Conflicting numbers across reports
- Manual data stitching
- Slow, stale dashboards
- Shadow spreadsheets
2. Driving adoption across departments
Tools alone do not create a data culture. BI adoption depends on behavior, not features. Many leaders still struggle to build a data culture. Executive ownership changes that. Training turns dashboards into daily habits.
- Executive ownership: leaders must use the data and hold teams accountable.
- Data literacy: sustained training builds confident, daily use.
3. Total cost of ownership and accountability
Hidden costs erode BI investments. The total cost of ownership goes past license fees. It includes integration, training, and rework. Spend per employee keeps rising. Clear ownership keeps value honest.
- License and capacity tiers
- Integration and pipeline upkeep
- Training and change management
- Rework from poor data quality
Enterprise BI Maturity: From Reporting to Prediction
Enterprise BI grows through clear stages. Each stage adds value and complexity. Most firms sit in the middle. The goal is to move up steadily. The table shows the path.
| Stage | Focus | Typical output |
| Descriptive | What happened | Reports and dashboards |
| Diagnostic | Why it happened | Drill-down analysis |
| Predictive | What will happen | Forecasts and models |
| Prescriptive | What to do next | Recommendations |
Moving up the curve takes data and discipline. Descriptive BI needs clean, governed data. Predictive analytics needs history and skills. Prescriptive BI needs trust in the models. Each step should prove value before the next.
- Start with trusted reporting
- Add diagnostic drill-down
- Layer in prediction carefully
Enterprise BI in Action: Industry Use Cases
Enterprise BI in action looks different by industry. The pattern stays constant. It is governed data and faster decisions. Adoption keeps broadening across sectors. Each sector ties analytics to its own metrics.
| Industry | Primary BI use case | Business metric |
| Retail | Demand and inventory forecasting | Inventory accuracy, margin |
| Financial services | Risk, fraud, compliance reporting | Loss rate, audit readiness |
| Healthcare | Operational and clinical analytics | Throughput, outcomes |
| Manufacturing | Supply chain and quality analytics | Downtime, yield |
Retail
Retailers use BI for demand and pricing. It raises inventory accuracy. It protects margin across channels. Real-time data guides replenishment. Analytics flags slow-moving stock early.
- Demand forecasting
- Markdown optimization
- Omnichannel inventory
Financial services
Banks rely on accurate, governed data. This is confirmed by banking data teams. BI supports risk, fraud, and compliance. Audit readiness improves with governance. Sensitive business data stays protected.
- Risk and exposure analysis
- Fraud detection
- Regulatory reporting
Healthcare
Healthcare ties analytics maturity to outcomes. This is shown in maturity frameworks. BI improves throughput and resource use. It supports clinical and operational analysis. Governance protects patient data.
- Operational dashboards
- Clinical quality metrics
- Capacity planning
Manufacturing
Manufacturers analyze supply chain and quality data. BI cuts downtime and waste. Real-time analytics flags defects early. Predictive models guide maintenance. Insight extends to suppliers.
- Predictive maintenance
- Yield and quality analytics
- Supplier performance
How to Choose the Right Enterprise BI Solution
Choosing the right enterprise BI solution starts with constraints. Match the BI solution to data, skills, and budget. Compare more than dashboards. Weigh integration and governance highest. Price alone is a poor guide.
| Approach | Best fit | Trade-off |
| Buy a BI platform | Standard needs, fast start | Licensing cliffs, lock-in |
| Build a custom BI solution | Unique, complex needs | Higher cost, longer timeline |
| Hybrid and composable | Scale with control | Needs strong architecture |
Evaluation criteria
Score each enterprise BI solution against real needs. Weight integration, governance, and adoption highest. Test claims on your own data.
- Data volume and source complexity
- Cloud platform and integration fit
- Governance, security, and compliance
- Skill mix across business and engineering
- Total cost of ownership, not license price
- Adoption and change-management plan
Questions to ask vendors
Ask vendors how the platform behaves at scale. Probe governance and semantic modeling. Check support and roadmap.
- How does it govern self-service?
- How does it model shared metrics?
- How does it scale to thousands of users?
- What is the real total cost of ownership?
Implementing Enterprise BI: A Practical Roadmap
Implementing enterprise BI is a program, not an install. Sequence the work in three phases.
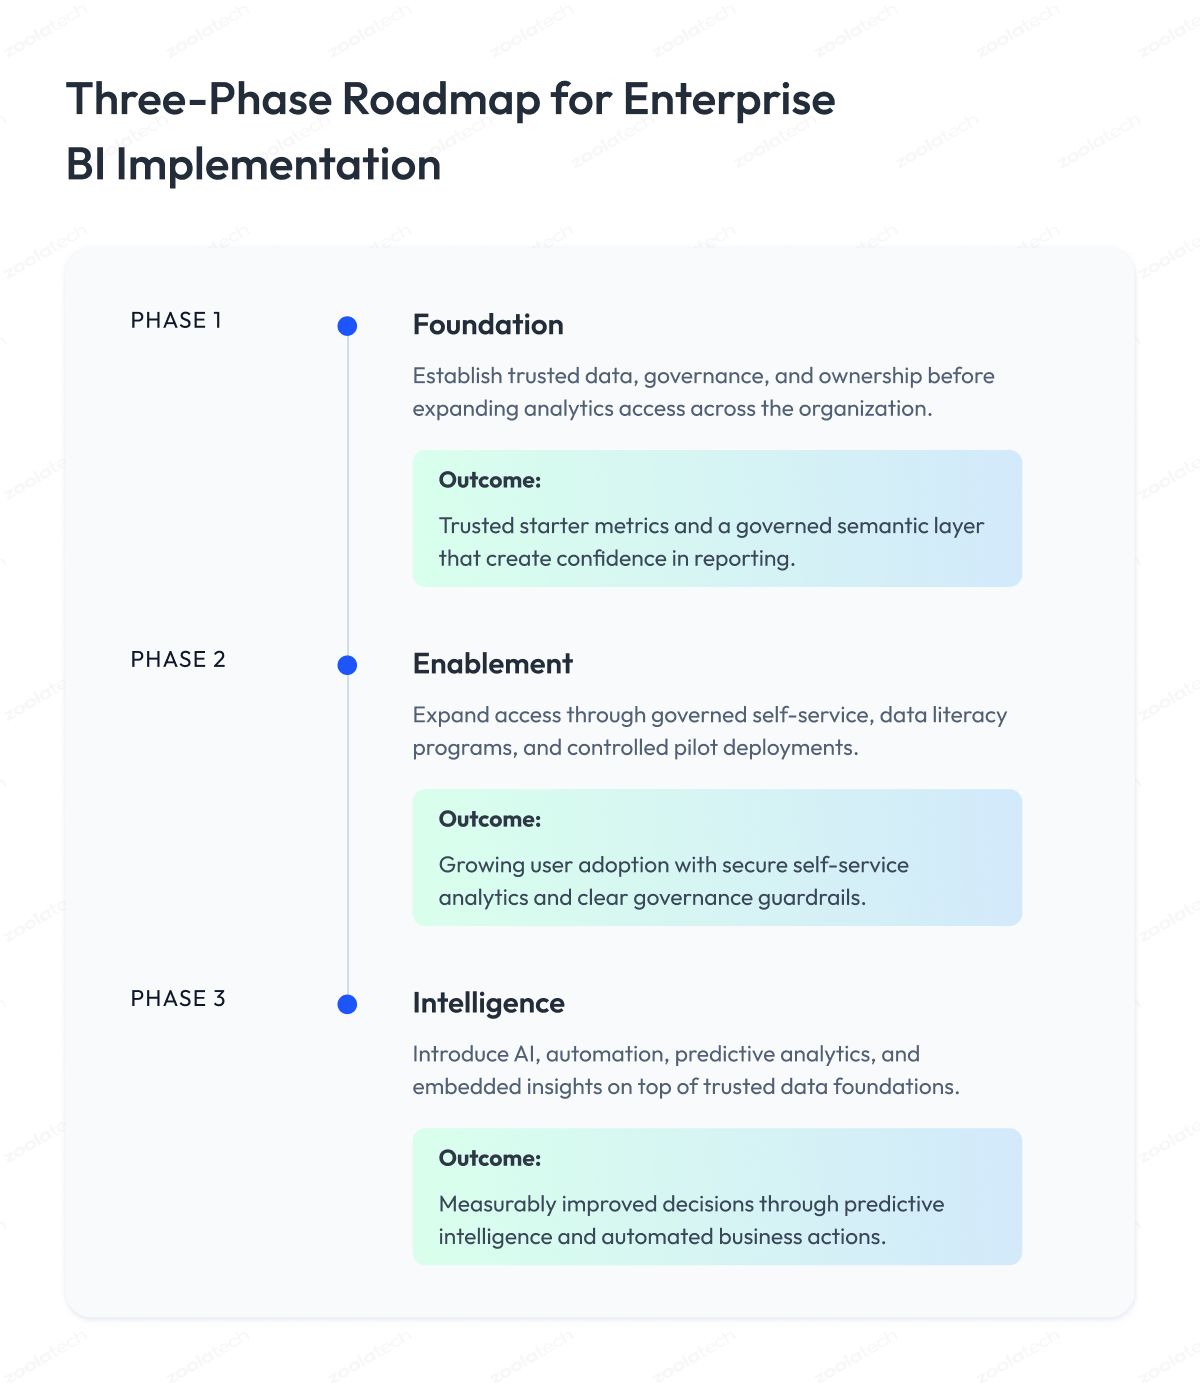
Each phase has an owner and an exit gate. You only move on when the gate is met. This approach mirrors the technologies behind digital transformation.
| Phase | Typical Duration | Key Deliverable | Exit Criteria |
| Foundation | 3 to 6 months | Governed semantic layer | Trusted starter metrics |
| Enablement | 3 to 6 months | Governed self-service | Rising weekly active users |
| Intelligence | Ongoing | AI and automation | A decision measurably improved |
Phase 1: Foundation
Fix the data before touching dashboards. This phase earns trust. Do the unglamorous work first.
- Inventory data sources: list each source, its owner, refresh rate, and a quality score.
- Assign data ownership: name one accountable owner per domain, not a committee.
- Certify a starter metric set: define 5 to 10 core metrics in a semantic layer, not hundreds.
- Fix the worst silos first: integrate the two or three sources that block top decisions.
Phase 2: Enablement
Now widen access without losing control. Start small and prove value. Then expand.
- Launch a governed pilot: pick one data-literate team and one real use case.
- Set self-service guardrails: split certified content from a sandbox, with clear labels.
- Build data literacy: run role-based training and name internal champions.
- Define request paths: give users one clear route for new metrics and access.
Phase 3: Intelligence
Add prediction only on trusted data. Target frequent, high-value decisions. Keep humans in the loop.
- Add prediction selectively: start where history is clean and the decision repeats often.
- Automate alerts: push exceptions to people, not just to dashboards.
- Embed analytics: surface insight inside the apps teams already use.
- Govern AI outputs: review automated decisions before they run unattended.
Where to start in the first 90 days
A small, sharp start beats a big-bang program. Take these steps first:
- Pick one high-value decision to support.
- Name the data owner and the metric definitions.
- Integrate only the sources that decision needs.
- Ship one certified dashboard to one team.
- Measure adoption weekly, then expand.
Common pitfalls to avoid
Most programs stumble on the same traps:
- Boiling the ocean: certifying hundreds of metrics stalls the whole program.
- Tool before trust: rolling out self-service on dirty data destroys confidence.
- AI too early: prediction on ungoverned data produces confident, wrong answers.
Using enterprise BI consistently creates value. The broader analytics market keeps growing. That raises the bar for results.
Measuring Enterprise BI Success: KPIs and Business Metrics
Enterprise BI success shows in outcomes. Dashboards alone prove nothing. Track adoption, trust, speed, and cost together. These business metrics guide future BI investments. They keep the program accountable.
| Category | Metric | Why It Matters at Enterprise Scale |
| Adoption | Weekly active business users | Idle tools deliver negative returns |
| Trust | Certified-metric coverage | Consistent numbers prevent disputes |
| Speed | Time to insight | Faster decisions beat competitors |
| Quality | Data accuracy rate | Bad data erodes every decision |
| Cost | Total cost of ownership | Hidden costs decide real returns |
| Governance | Access-policy compliance | Protects sensitive business data |
Key Enterprise BI Terms
Clear terms help teams align on enterprise BI. The glossary below defines the basics. Each definition stays short and practical.
| Term | Meaning |
| Enterprise BI | Organization-wide system that integrates, analyzes, and delivers trusted data for business decision-making. |
| BI platform | Software that connects data sources, provides analytics, and delivers reports, dashboards, and visualizations. |
| Semantic layer | Shared business definitions of metrics and dimensions that ensure consistent reporting across the organization. |
| Data warehouse | Central repository that stores integrated historical and current data for reporting and analytics. |
| Self-service BI | BI capabilities that let business users create reports, dashboards, and analyses without relying on IT. |
| Data governance | Policies, processes, and controls that ensure data quality, security, consistency, and regulatory compliance. |
Conclusion
Enterprise business intelligence rarely fails on technology. It fails on governance, trust, and adoption. More tools do not fix that.
Winners treat BI as a program. They fix data foundations first. They measure adoption as closely as spend.
The choice is not which BI platform to buy. It is whether to build the discipline behind it. Enterprises that do will decide faster than rivals.
Questions You May Have
What is enterprise business intelligence?
Enterprise business intelligence turns governed business data into trusted insight across the enterprise.
How does enterprise BI differ from traditional BI?
Enterprise BI scales further, governs tighter, and adds real-time data and self-service.
What are the core BI capabilities of an enterprise BI platform?
They span integration, warehousing, reporting, dashboards, analytics, governance, and collaboration.
Why do enterprise BI adoption programs fail?
They fail on data silos, weak adoption, and unclear ownership, not the chosen tool.
How do you choose the right enterprise BI solution?
Match the BI solution to your data sources, skills, governance, and total cost of ownership.
How is enterprise BI different from ERP?
ERP runs operations, while enterprise BI analyzes the data those systems produce.
What deployment models does enterprise BI support?
It supports on-premises, cloud, hybrid, and embedded analytics models.
What business metrics measure enterprise BI success?
Track adoption, time to insight, data accuracy, total cost of ownership, and governance compliance.