


A proper, visually comprehensive dashboard is an important part of an e-commerce CMS. Moreover, it’s a vital piece of the commercial success of any online store.
Read on to find out how to build an e-commerce dashboard that’s to the point, effective, and intelligible for all concerned.
Your e-commerce store engine is your most important weapon in business. It’s your bazooka that keeps you ahead of your competition in that perpetual hunt for the mammoth. If somebody else’s bazooka is better, the fattest mammoth may eventually go to that person.
But your weapon is only as good as its parts. If the rear sight of your revolver is loose, chances are you will miss your target. Similarly, no e-commerce CMS is perfect without a tightly mounted dashboard. Just like a sight on any gun, it allows the metaphoric shots of e-commerce to go where they belong.
- How do you even build a dashboard for e-commerce?
- What is a dashboard?
- What KPIs do you need to include in the first tiles of the visualization?
- What are the best out-of-the-box e-commerce analytics dashboards?
- What channels do you source information from?
Zoolatech is a team of software development experts in Retail Data Analytics and Business Intelligence.
That’s why we are delighted to share some of our practical insights into the nuances of coding a perfect dashboard for retail and e-commerce.
What Is an E-Commerce Dashboard?
An e-commerce dashboard is part of the e-commerce website CMS or a standalone piece of software with a visual representation of the most vital business KPIs, designed in visually comprehensive graphs and colorful charts for quick decision-making.
Such a board usually accumulates data from a variety of sources, like Google Analytics, inventory management software, social media tools, financial reports, and so on. The best dashboards for e-commerce and retail will have different access levels and multi-departmental segments of the tool.
Do You Need a Custom E-Commerce Dashboard?
It should be noted that there are a few ways to approach the matter, based on where you are in the genesis of your online store.
If you use an e-commerce platform, like BigCommerce, Shopify or Magento, you are likely to opt for a specifically developed app or tool that is initially designed to be compatible with your platform of choice.
In case you have cared to create a unique piece of custom e-commerce development, you have 4 options:
- To integrate this website with a ready-made dashboard and analytics tool.
- To create a custom tool, just like you developed a unique online shop.
- To use ERP or BI integration to get access to neatly presented business data.
- To use a combination of the above.
Why do online stores pay to have this tool?
- To obtain a quick overview of daily/weekly results.
- To get alerts about force majeure situations or sudden drops and spikes in performance to be able to counteract them in a timely way.
- To get a sense of market trends and the by-the-minute state of competition.
- To get your team trained to spot peaks, valleys, fluctuations, and jump in to investigate and rectify the situation if need be.
- To keep the team motivated to outperform the figures in budgets and forecasts by reiterating such dependencies daily during morning catchup.
- To re-adjust funding towards the revenue-generating department and bring focus to the high-spenders.
- To base decisions on facts, trends, and historical knowledge.
- To monitor and fine-tune decisions being made based on facts and solid digits.
This is just a partial enumeration of the benefits that come along with the implementation of the mission control center for your CMS.
Sources of Data for Dashboard Creation
Some sources provide a clear, well-organized graphical representation of their data, with many traceable data points, but the benefit of the dashboard is that it combines data from different sources and provides a granular level of detail unavailable elsewhere.
It also allows users to pull all data onto a single page in the CMS, which serves as a major aggregation point for this specific access role.
For example, a CTO might want to know about any inconsistency in the servers’ functioning. Every second in page loading time costs a store 100K per day or $2.5 million a year. But it’s still not necessarily a top priority for a CEO.
The key sources that may supply data to an e-commerce reporting software will be social networks, Google tracking and analytics tools, CRM, payment systems, inventory management software, email marketing platform, warehouse software, Google sheets, BI or ERP solutions, if used, among many others.
Retail Dashboard: KPIs That Are Critical for Online Store Health Monitoring
There are several KPIs that should be the focus of attention for any e-commerce entrepreneur.
Below are the vital Key Performance Indicators that are on the radar of all aspiring Jeff Bezos of the world:
Overview dashboard
The most common and high-level overview that is great for business owners and C-level execs would usually have top metrics that signal major performance trends:
- Sales & finance: revenue, sessions, conversion rate, average quantity, average price, cash flow, payments, taxes
- Conversion funnel: sessions, product views, add to cart, transactions
- Checkout funnel: added to bag, my order summary, payment screen, transactions
- User stats: new vs returning sessions, sales & transactions
- Top GEO locations
- Top Channels
- Top Campaigns
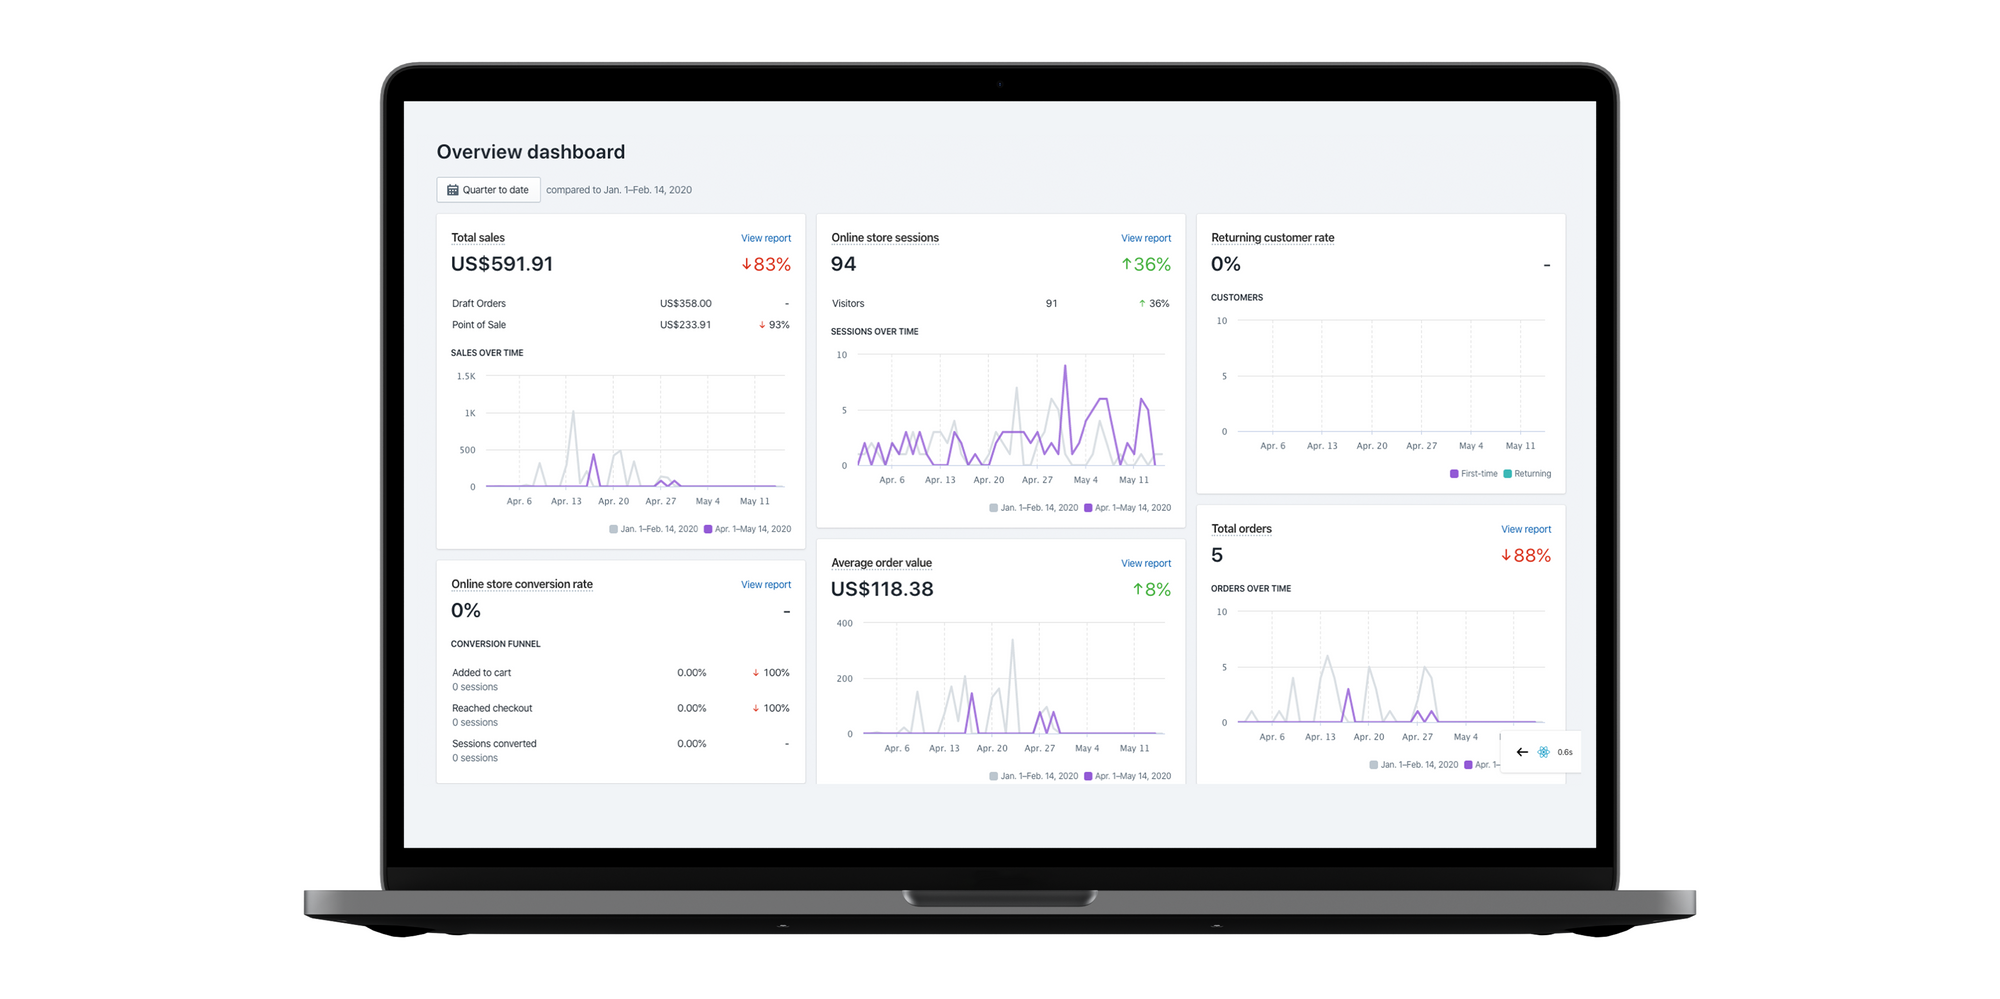
Shopify Overview Dashboard provides metrics such as:
- Average order value (average check is a big KPI for e-commerce)
- Conversion rate (Major marketing metric)
- Sessions by: (quantity does not equal quality, but is still important)
- device type (which device performs best / worst / why?)
- location (which Geo sells best? Any change in the leader? Why?)
- traffic source (Did commercial work? Does a new hire bring results? Referrals started producing?)
- social source (change of a leader? SMM strategy to be reviewed?)
- Repeat customer rate (MTD / YTD deviation? The reason behind peak repeat customer stats?)
- Sales by: (This monetary KPI allows for monitoring dynamics between segments in dollar value)
- POS location (sudden changes and growing trends are vital)
- social source (which media gives the most revenue, what’s the dynamics and why?)
- staff (know your top and bottom performers, find reasons behind spikes, replicate success in another geo)
- traffic source (any new strong referral partner? Which channel produces the most revenue?)
- Top: (top performers are important to monitor, as they are 20% of Pareto principle)
- landing pages
- products by units sold
- referrers by sessions
- Total: (major KPIs below)
- online store sessions
- orders
- sales
- Sales attributed to marketing
Financial dashboard (incl taxes, payments, profits, revenues)
Apart from the top-line figures, like total revenue for the day / week / month and its variance from the respective comparative period in absolute figures and percentages, the financial dashboard will have information like:
- Average billing
- Taxes
- Payments in by payment method
- Payments due
- Operational costs
- Sales by vendor
- Payments due by vendor
- Lost revenue / Cost of return
Such a detailed dashboard should be accessible to the accounting department, financial director or CFO, sales management, and the purchasing team to monitor their accounts from a payment perspective.
Real-time / Live view dash
A real-time dashboard is usually more of a sales-like screen with technical details on categories, products, average billing, revenues, and session(s) in progress at the moment of looking at the data visualization.
Marketing dashboard for e-commerce
There are multiple dashboards in this subcategory that have to do with general marketing: digital and offline, SEO-focused, email marketing-related, and more.
As a minimum requirement, these visual graphs may entail:
- Lead funnel
- Web visits
- Captured lead
- Qualified lead
- Sales accepted
- Opportunity
- Win
- Traffic sources
- Sales by product
- Sales by Country
- Completion rate
- New vs Returning customers
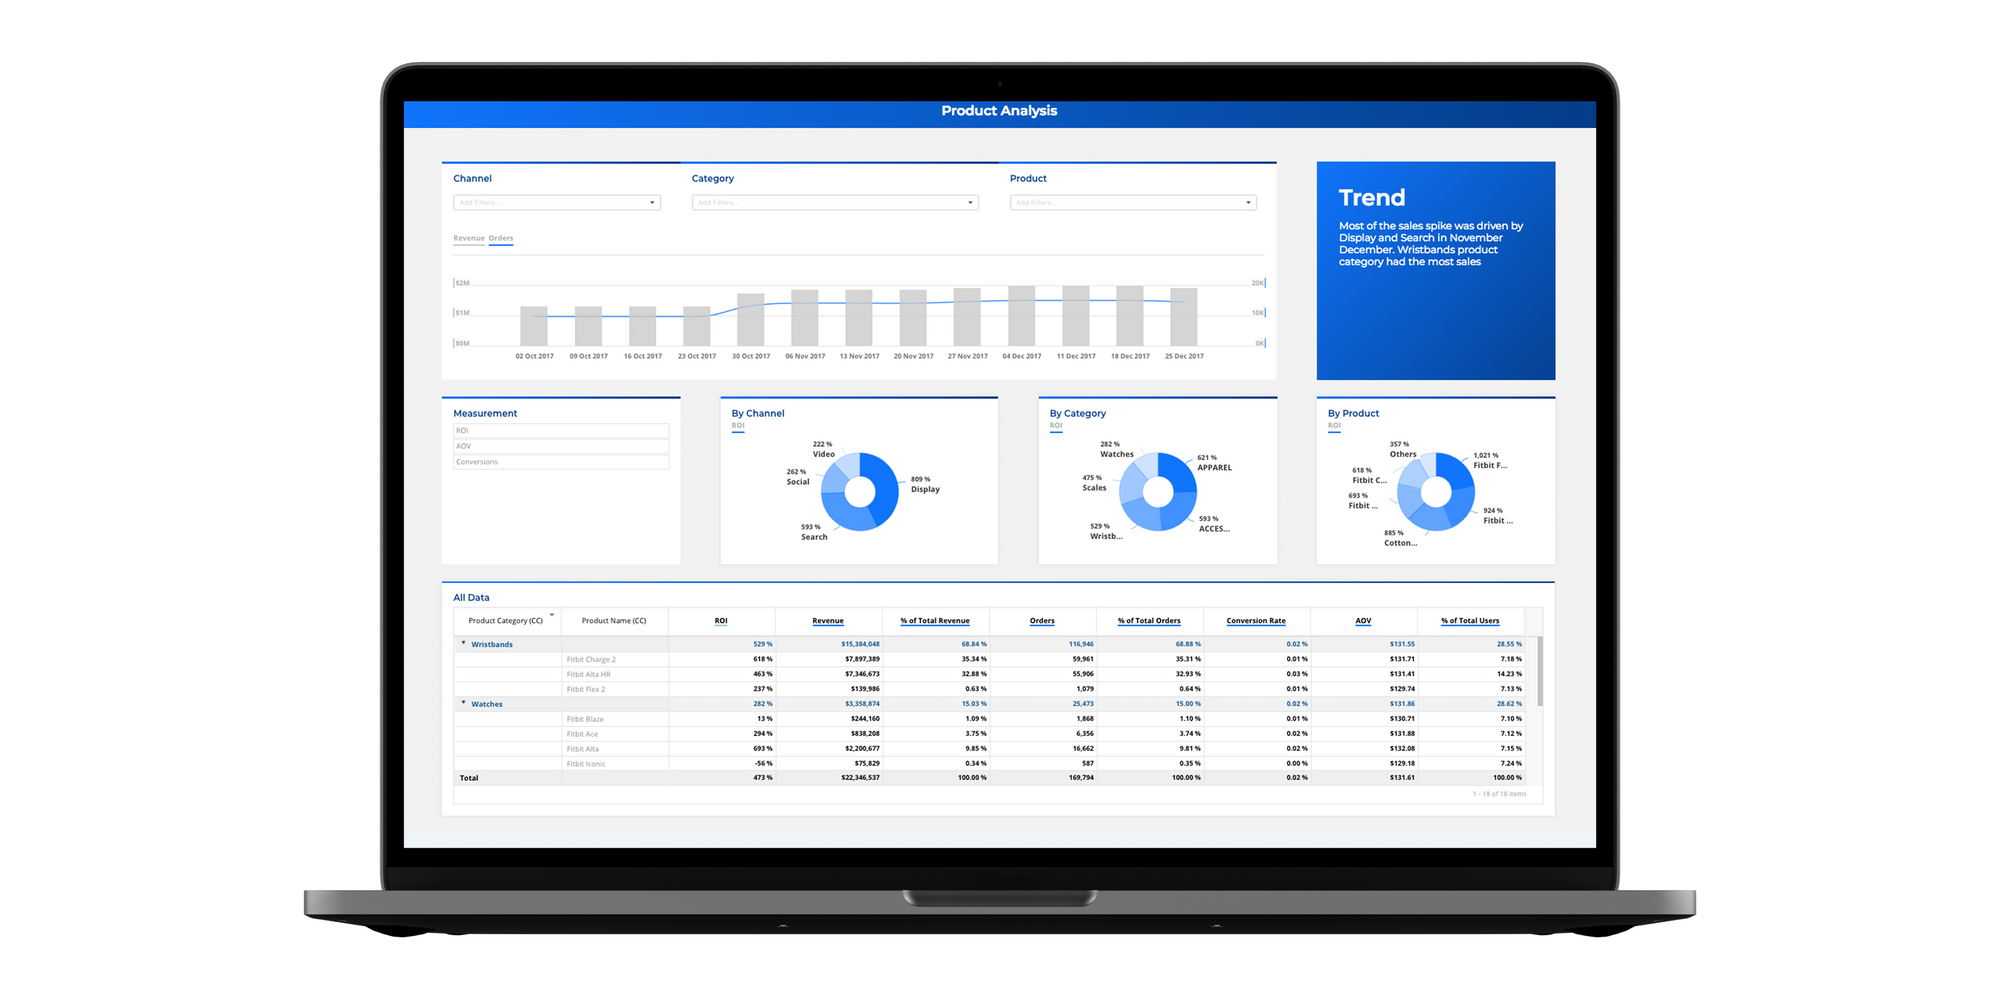
Product Analytics / Orders / Inventory report
The product dashboard will usually have filters like:
- Product
- Category
- Channel
- Supplier
In terms of metrics, such a visualization may include:
- Total revenue (with % of total revenue)
- Orders (with % of total orders)
- ROI
- AOV (average order value)
- Conversion rate
So a user can drill down into the nitty-gritty of what’s moving and whatnot, see the top and worst-performing items by each of the chosen parameters in a specific channel, category, or combination.
Supply chain dashboard
The metrics used in such a visual tool may include:
- Unit per transaction (APV: Average Purchase Value in $ + UPT)
- % out of stock items
- Cost of Carry (split by cost centers, like admin, freight, risk, service, storage)
- Inventory Turnover (could be designed as a bar chart by a period with linear budgeted target)
Shipping status dashboard
This dashboard may have all orders lined up and sortable by order status:
- Backordered
- On Hold
- Shipped
- Delayed
The scorecard section with dashboard major KPIs may contain the following parameters:
- Orders to ship
- Open POs
- Late vendor shipments
- Overdue shipments
Monthly KPIs may contain:
- Total inventory, $
- Shipping costs, $
- Perfect order %
- Backorder ratio %
Abandoned carts
During e-commerce dashboard development, it is important to provide an overview of the most vital step in the conversion funnel: shopping cart statistics.
This is a critical tool for both marketing and the web dev team, as they can pinpoint the step of the process that triggers people to abandon the cart, drill down into reasons, and adjust accordingly. For example, they may find a low-quality image attached to the product, an extra zero in a price, or a too-long form to fill out in terms of customization.
In-store search
Search is an important parameter to keep an eye on to better understand the traffic that comes your way, spot the technical mistakes for specific products/categories, or otherwise diagnose user behavior.
The data used for such a board would be of interest to web developers, marketing, and sales, who can monitor and address any irregularities on the screen.
This tool may use the cloud of search terms in correspondingly differently sized terms to provide an easy-to-grasp visual representation of the most searched terms.
It may also have a list of search terms used by online store visitors with the classical e-commerce & SEO metrics.
The filtering options are up to the business, with some users choosing to have the data sorted/filtered by channel/vendor/category.
Out-of-the-Box Dashboard Software Solutions for Online Sales
In addition to Google DataStudio, which is a universal tool for creating dashboards for pretty much every industry, there are several software tools that offer the possibility to create your own customized dashboard.
Here are some of the best e-commerce Dashboard & Analytics software systems:
They do come at a monthly fee with varied pricing plans that need investigation before purchasing.
Zoolatech: Your E-Commerce Reporting Software Development Company That Knows How
If you decide to develop a custom dashboard for your e-commerce store or retail business, or if you venture to integrate one of the ready-made tools, Zoolatech’s e-commerce analytics team will help create tools for 360-degree data visualization.
We know how to create a custom e-commerce dashboard tailored to suit your operational needs, depending on your current tech stack, GEO, sales volume, ambitions, and within your budgets. You can learn more about our DataDog experience.
Based on our extensive e-commerce software development expertise, we know the ROI of a well-built data visualization tool, available for top management for daily monitoring. We’ve seen our clients making instantaneous decisions based on updated data to save or make tens of thousands of dollars in hours.
The convenience of having your top management exposed to key metrics far surpasses the temporary disruption of the hassle of building an e-commerce dashboard.
Having your team on the same page at all times with access to historical data – brings ROI in motivation, greater corporate spirit, and higher sales through a better understanding of business processes.
Let’s get your mission control center up and running to achieve your mission quickly!