








Quick Summary
- Most failures come from one or two interacting factors: NIST found that 2-way interactions cause 53–97% of failures, so you can sample combinations instead of testing all of them.
- 6 brands, 8 devices, 4 locales, 3 tiers, and 10 feature flags make 589,824 configurations, yet 48 pairwise tests cover every pair, and the 10 flags add 0 tests.
- Your minimum suite size is the product of your two largest axes, so 6 brands × 12 devices means 72 tests, and every other axis rides along at pairwise strength.
- Keep one parameterized suite driven by a variant model rather than one per brand. Predictive test selection then halves infrastructure cost while still reporting over 95% of failures.
- If your whole matrix is under 100 combinations, run it exhaustively in one CI pass. Covering arrays only pay off once brands × devices pushes you past roughly 1,000.
Test automation at scale means your testing costs stay the same even when one product turns into dozens of versions. Those versions come from different brands, devices, countries, pricing tiers, and feature flags that switch functions on or off.
In our work with enterprise teams, we see the same gap in the test automation strategy.
The suite built for one product gets copied for each brand, the copies slowly drift apart, and every new version needs more testers. Nobody can say what the next brand or device will cost, so the team just keeps hiring.
That is why we wrote this guide on how to scale test automation across product variants.
We show how to break that link. You will see what breaks first when one product becomes forty, the five variables that multiply your test matrix, and the math that shrinks 589,824 configurations to 48 tests.
You also get the Variant Cost Ladder, which prices each new variant in tests, plus the architecture, metrics, and upkeep that keep a large suite trustworthy, and the points where experts still disagree.
By the end of this article, you will have a working method to scale test automation across all your product variants. You will know the minimum number of tests your product needs, which variants to test before release and which to monitor in production, how to structure one suite that serves every brand, and which metrics prove the approach is working.
Why Test Automation Stops Working When a Product Has Many Versions
Test automation stops working at scale the moment a team copies the test suite for every product version. After that, every new version adds the same amount of upkeep again. If one suite takes ten hours a month to maintain, forty copies take four hundred.
Teams write automated tests for one specific product, with fixed screens, prices, and settings baked in. When the same product ships in many versions, each of those fixed details becomes a place where a test can break.
The usual reaction is to copy the suite. A team takes the tests that work for brand A, copies them, and adjusts them for brand B, then for brand C. Two years later there are forty suites, each slightly different, and a fix made in one never reaches the other thirty-nine. Automated regression testing that used to take a night now takes a week.
Practitioners spot this trap themselves. In a Ministry of Testing discussion on running any test case against any customer environment, the author worried that a separate test case per customer “defeats the objective.” A reply in the same thread put the decision above the tester’s pay grade, because “this is about effort, money and risk.”
Two more things break, and teams rarely plan for either:
- Test environments. With one product, staging can copy production. With forty versions, production is forty different things, and no staging setup can mirror them all.
- Dashboard numbers. A 98% pass rate sounds healthy. It can also mean thirty-nine brands pass and one brand fails every test, because that brand is only 2.5% of the suite. The average hides exactly the failure you most need to see.
The table shows how six parts of test automation change once the product multiplies.
| Area | One Product | Forty Versions |
| Test architecture | One suite hard-coded to the product | One parameterized suite driven by variant config |
| Test selection | Everything runs on every build | Sampled combinations per build, full run per release |
| Test data | Fixed fixtures | Data generated per variant from shared model |
| Environments | Staging mirrors production | Golden variant plus two most divergent ones |
| Ownership | One QA team owns the suite | Product teams own tests, QA owns model and rules |
| Metrics | Aggregate pass rate | Per-variant pass rate and escaped defects |
Mobile products hit this wall first, because the device axis multiplies on its own. We covered what breaks in enterprise mobile at scale separately. Here the focus is the arithmetic that applies to every axis, and for that you need to know which five variables you are multiplying.
The Five Variables That Multiply Your Test Matrix
Five variables multiply a test matrix:
- Product tiers.
- Tenant or white-label brands.
- Device and OS combinations.
- Feature flags.
- Regional locales.
Each one adds a dimension, and the total number of configurations is all five multiplied together.
Think of it as a spreadsheet with five columns. Column one lists your pricing tiers, column two your brands, and so on. Each row is one setup a customer could run.
Three tiers, six brands, eight devices, four locales, and ten on/off flags give you 589,824 rows. That is your test matrix, and the next section shows how to shrink it.
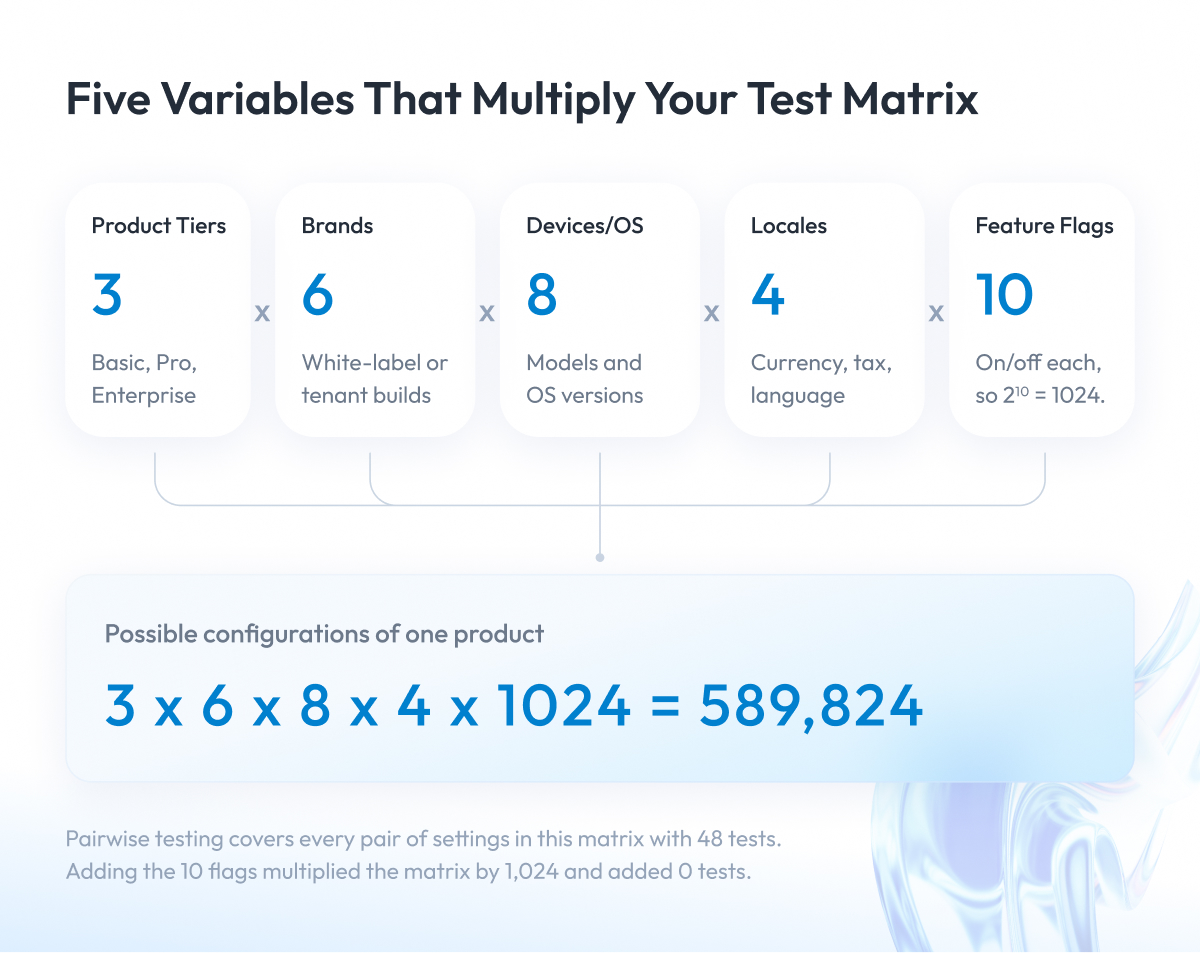
Each variable breaks tests in a different place, so it helps to know them one by one.
1. Product tiers
Failures cluster at the edges between tiers. Typical examples are a price and tax interaction right at the boundary, a premium feature that leaks one tier down, and a bundle that refunds the wrong amount when only part of it is returned.
2. Tenants and white-label brands
The visible failure is a wrong logo. The dangerous one is a customer seeing another customer’s data, or per-tenant config drifting until no test environment matches any live tenant. We covered why authorization checks get hard here in our piece on application security testing at enterprise scale.
3. Devices and OS versions
Rendering at unusual screen densities, manufacturer changes to system behavior, permission rules that shift between OS versions, WebView version skew. This is the axis where mobile app testing usually eats the budget, and where a dedicated native mobile test automation setup earns its place first.
4. Feature flags
Two flags that each work alone and break together, plus old flags nobody removed, so the number of combinations grows every quarter. Datadog’s flag documentation marks a flag as stale after 30 days at full rollout with no changes, which is a sensible default for your own cleanup rule.
5. Locales and regions
Money is the usual culprit. Under ISO 4217, the Japanese yen has no decimal places and the Kuwaiti dinar has three, so an assertion that expects two decimals fails in both markets. Add tax calculation order, date formats hard-coded into tests, right-to-left layouts, and translated strings that no longer fit the button.
The table sums up what breaks on each variable and what keeps it under control.
| Variable | What Breaks | What Keeps It Under Control |
| Product tiers | Price, tax, and entitlement errors at tier boundaries | Boundary tests on pricing engine, invariant checks on totals |
| Tenants / white-label | Cross-tenant data leakage, per-tenant config drift | One parameterized suite, contract tests, golden tenant plus two divergent |
| Devices / OS | Manufacturer quirks, permission changes, WebView skew | Risk-weighted device matrix from own analytics, per-cohort crash monitoring |
| Feature flags | Flag pairs broken together, stale flags piling up | Pairwise tests on interacting flags only, stale-flag retirement |
| Locales | Currency minor units, RTL layout, string expansion | Pseudo-localization in CI, money invariants, in-region synthetic probes |
Some of these controls cost almost nothing. Android ships two built-in pseudolocales that stretch every string and flip text direction, so layout failures show up in CI before a single translator is hired. The device matrix is the opposite case: build it from your own analytics, because a US product weighted by worldwide market share ends up testing the wrong phones.
Now, the number that matters. Of those 589,824 rows, how many do you need to run?
The Math: Why You Cannot Test Every Combination
You cannot test every combination, and you do not need to, because most failures involve only one or two interacting factors. A product with six brands, eight devices, four locales, three tiers, and ten feature flags has 589,824 possible configurations. Forty-eight tests cover every pair.
Here is what “every pair” means. Take any two variables, say brand and device. Pairwise testing guarantees that each brand meets each device in at least one test. Brand A runs on device 3 somewhere, locale JP meets the Pro tier somewhere, and so on for every pair of values. One test row covers many pairs at once, which is why the total stays small.
Why is that enough? Because bugs rarely need five things to line up.
NIST studied failures across six systems and stated the pattern as an Interaction Rule: “Most failures are induced by single factor faults or by the joint combinatorial effect (interaction) of two factors, with progressively fewer failures induced by interactions between three or more factors.”
In NIST’s own data, two interacting factors explain 53% to 97% of failures depending on the system, three factors explain 74% to 99%, and no failure anywhere needed more than four to six factors together.
The table shows what that does to a test matrix. We computed each figure independently and machine-checked it for full coverage at each strength.
| Configuration | Exhaustive | Pairwise (2-Way) | 3-Way |
| 6 brands × 12 devices × 8 flags | 18,432 | 72 (256× fewer) | 148 |
| 6 brands × 8 devices × 4 locales × 3 tiers | 576 | 48 | 192 |
| Same, plus 10 feature flags | 589,824 (1,024× bigger) | 48 (+0) | 195 (+3) |
| 10 binary feature flags alone | 1,024 | 9 | 20 |
Three things to take from the table:
- Flags are nearly free. Adding ten feature flags multiplies the full matrix by 1,024 and adds zero pairwise tests. The flags ride along inside rows that already exist, as long as you sample instead of enumerate.
- The floor is the product of your two largest variables. Every brand must meet every device at least once, so six brands and twelve devices means 72 tests minimum, and six brands and eight devices means 48. That product is the true floor on white-label QA cost, and you can compute it this afternoon.
- The sizes are upper bounds. They come from a greedy algorithm, so an optimizer might shave a row or two. The effect only grows with the matrix: NIST’s own example is 34 on/off switches, about 17 billion settings, where 33 tests cover every 3-way interaction and 85 cover every 4-way one.
When is this overkill?
- Under 100 combinations: run everything in one CI pass and skip the tooling.
- Past roughly 1,000: covering arrays start paying for themselves.
- In between: pairwise still helps, but the savings may not justify adding a new tool to the pipeline.
The tooling itself is free.
Microsoft PICT is open source, NIST ACTS is public domain, and Hexawise is the commercial option. PICT and ACTS both accept constraints, so impossible combinations (a tier that does not exist for one brand, a device that never ships in one region) are excluded when tests are generated instead of filtered out afterward. That detail matters for tiers and tenants, and almost nobody mentions it.
So brands and devices set the floor, and flags cost nothing. The next section turns that into a ranking you can use.
The Variant Cost Ladder: What Each New Variant Adds in Tests
The Variant Cost Ladder answers one question: when you add a new brand, device, locale, tier, or flag, how many more tests does it cost you? The ladder ranks the five variables by that cost, from expensive at the top to free at the bottom.
The ranking comes straight from the math above. A pairwise suite is never smaller than your two largest variables multiplied together, so those two are the only ones that add tests every time they grow. Everything else fits into existing rows.
Here is what that looks like in practice.
Your product has six brands and eight devices, so your floor is 48 tests. Add a seventh brand, and the floor becomes 56: eight new tests. Add a tenth feature flag, and the floor stays at 48: zero new tests. Most teams expect the opposite, because ten flags sound scarier than seven brands.
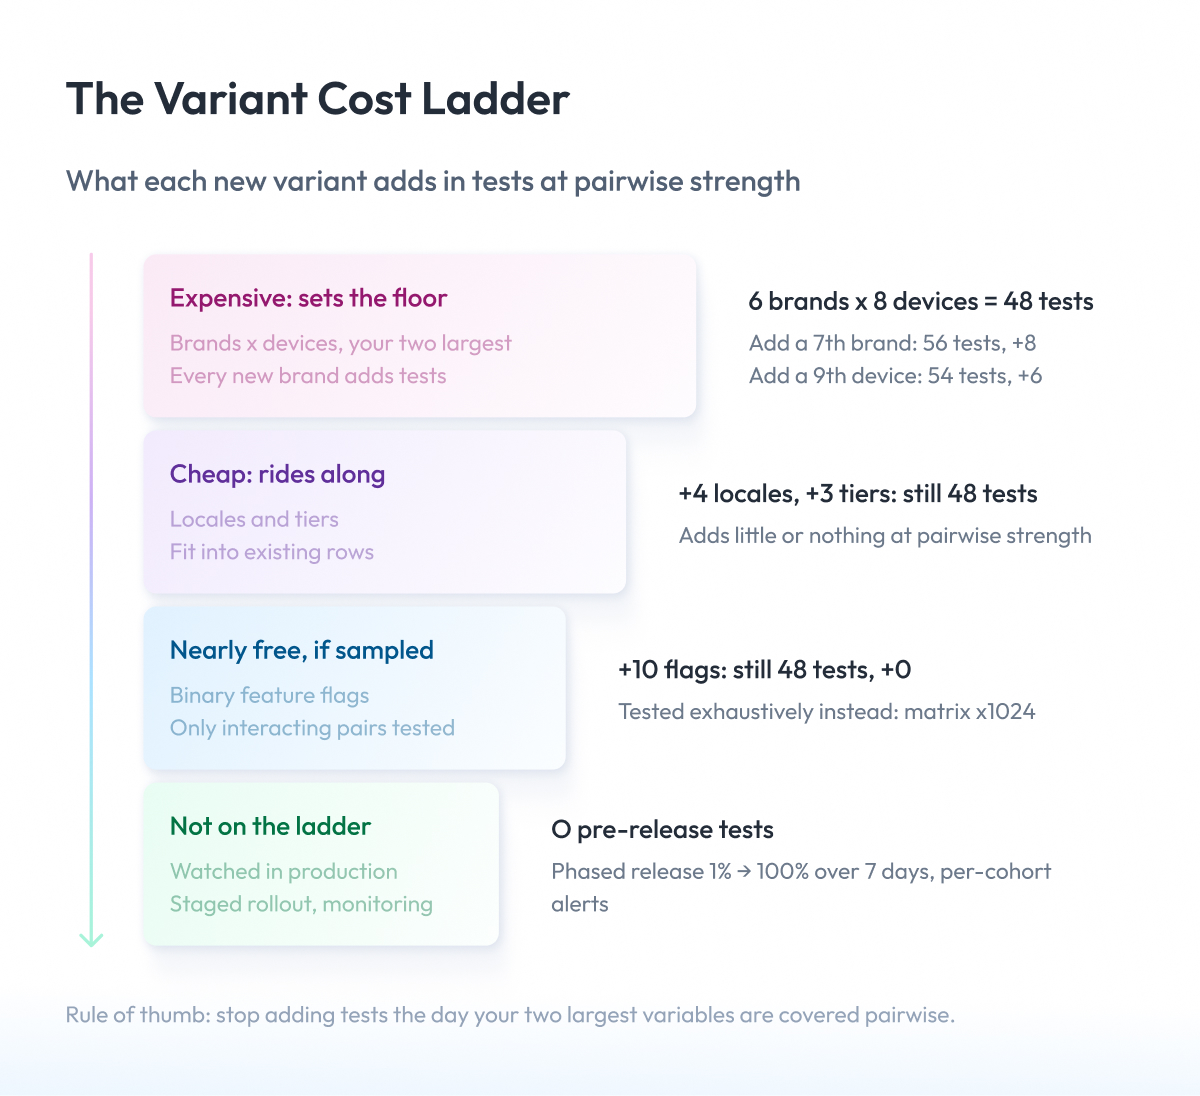
The four rungs, from most to least expensive:
- Expensive: sets the floor. Your two largest variables, usually brands times devices. Their product is the minimum size of any pairwise suite, so adding a brand here costs tests every time.
- Cheap: rides along. Every variable below the top two, including locales and tiers. At pairwise strength they add little or nothing, because their values fit into rows the top two already created.
- Nearly free, but only if sampled. Binary feature flags. Ten of them added zero pairwise tests in the worked example. Tested exhaustively instead, they become the most expensive item on the list.
- Not on the ladder at all. Anything you decide to watch in production instead of testing before release. Apple’s phased release sends an update to 1% of users on day one and reaches 100% on day seven, which is a built-in sampling mechanism for low-risk variants.
Now fill in your own numbers. List your variables, count each value, and multiply the two largest.
| Your Variable | How Many Values | Worked Example |
| Brands or tenants | ___ | 6 |
| Device and OS combinations | ___ | 8 |
| Locales | ___ | 4 |
| Product tiers | ___ | 3 |
| Feature flags that interact | ___ | 10 |
| Full matrix, everything multiplied | ___ | 589,824 |
| Two largest multiplied, your pairwise floor | ___ | 6 × 8 = 48 |
The floor tells you the suite size. It does not tell you which variables deserve a test before release and which can go to staged rollout.
A variable earns a pre-release test when a failure on it is either irreversible or invisible to monitoring: money, entitlements, tenant data isolation, and anything regulated. Everything else goes to staged rollout with per-cohort monitoring, and you stop adding tests the day the top two variables are covered pairwise.
That decision is part of test automation strategy, and it belongs to engineering leadership, because it trades effort against risk. It is also where we usually start when a client brings us their matrix through our QA and software testing services.
A floor and a ranking still need a suite that can run them without splitting into forty copies. That is the architecture question, and it comes next.
How to Scale Test Automation Without Multiplying the Suite
To scale test automation without multiplying the suite, write each test once and run it with different settings. Instead of a login test for brand A, another for brand B, and a third for brand C, you write one login test that reads the brand name, the device, the locale, and the flags from a settings file. Run it forty times with forty settings files, and you have tested forty brands with one test.
That settings file is called a variant model. The variant lives in the model, and the test code stays the same for every brand and tenant.
The basics come first, and they are the same as for any large test automation framework.
- Framework. One framework for all variants, with variant values loaded from config instead of written into the tests.
- Environments. One main variant plus the two that differ most, updated from production config on a schedule.
- CI/CD. A pairwise subset on every commit, the full pairwise set nightly, and the 3-way set before release. CI/CD automated testing at this cadence is what continuous testing means in practice, and it is shift left testing in its useful form, with the variant check running at commit time instead of at release.
- Tagging. Every test is tagged by the variable it checks, so a failure on one brand is reported as that brand’s failure.
- Reporting. Per-variant results first, then the overall number.
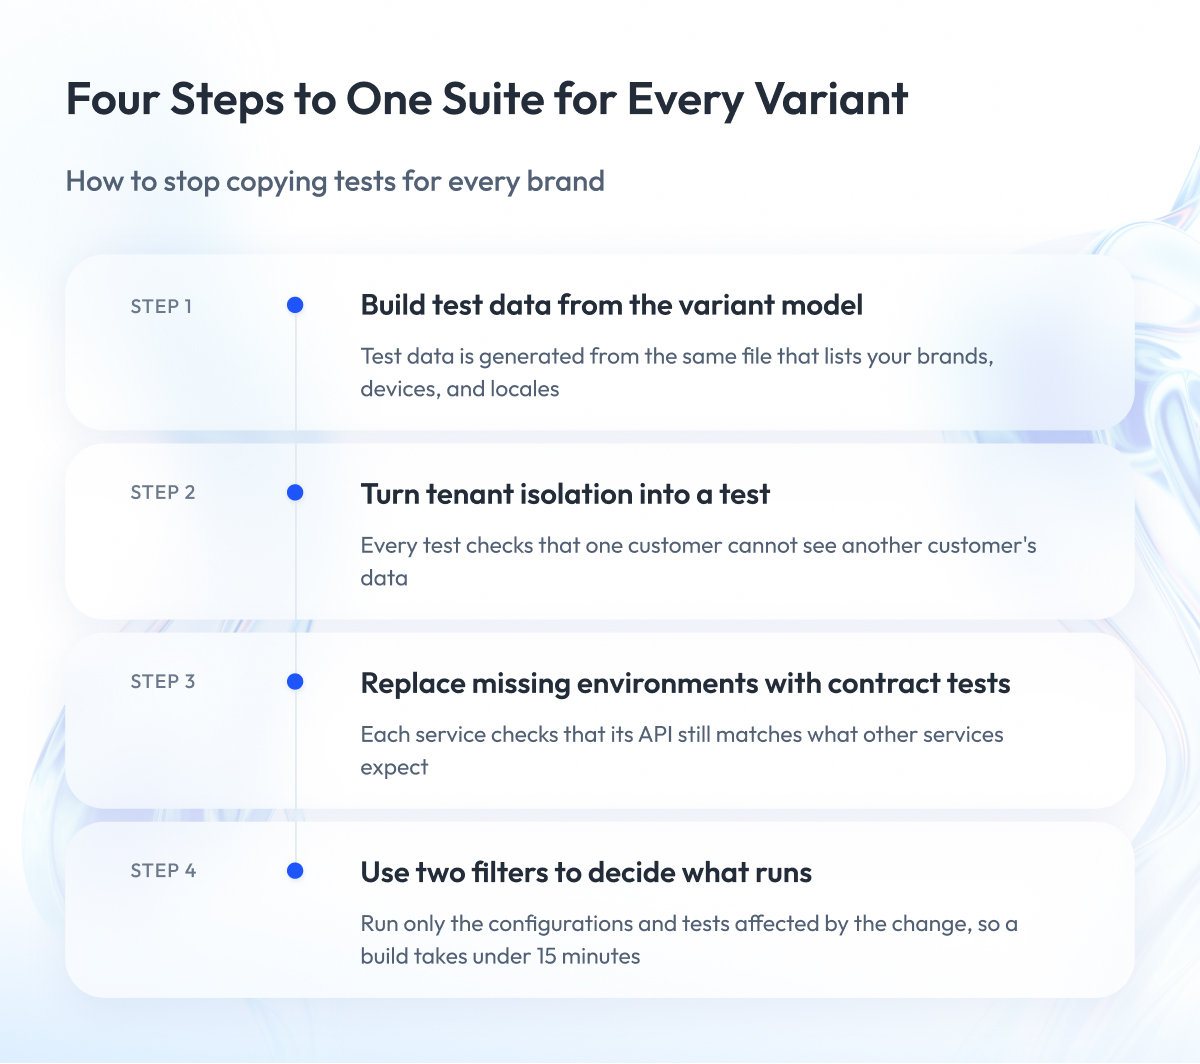
Those five keep the suite running day to day. The next four steps keep it accurate as variants grow, and this is the sequence we usually go through with enterprise clients once the basics are in place.
Step 1 – Build test data from the variant model
We start with the file that lists the client’s variants and write a small generator that creates test data from it. For the row “brand C, device 5, locale JP, tier Pro,” the generator produces a brand C customer with a JP address, yen prices, and a Pro subscription.
Then we delete any hand-made fixtures that describe the same customers. From that point test data and test config come from one file, and they cannot drift apart. This is what test data management means at scale.
Step 2 – Turn tenant isolation into a test
Next we add one assertion to every test that reads data. The result must contain records from the current tenant only. It lives in a shared helper so nobody has to remember it, and the helper gets a named owner on the client side.
If the assertion ever fails, we treat it as a security incident, because a customer could see another customer’s data.
Step 3 – Replace missing environments with contract tests
Nobody can build a staging copy of forty production tenants, so we stop trying. For each service that other services call, we write a contract test, a short description of the requests it accepts and the responses it returns.
The contract runs on both sides in CI. When a tenant backend changes its API, the contract test fails before the change reaches a customer.
Pact and Spring Cloud Contract are the tools we reach for. The pattern comes from Ian Robinson’s consumer-driven contracts.
Step 4 – Use two filters to decide what runs
Finally, we set up two filters in the pipeline. The first is the covering array from the math section, which picks the configurations that run on this build. The second is test impact analysis, which picks the tests affected by the code that changed in this commit.
The pairwise subset of affected tests runs on every commit, and the full pairwise set runs nightly. Together, these filters keep a commit build under fifteen minutes, even with 3,000 tests in the repository.
After these steps, the test suite is one of three quality tools rather than the only one.
- Sampling before release.
- Isolation during the run.
- Monitoring in production.
Your DevOps services setup owns the second and third as much as QA owns the first.
Ownership changes too. Product teams own the tests for their variables, and a small central QA group owns the variant model, the selection rules, and the reporting. When that central group doesn’t exist, extending the team with a few senior automation engineers is usually faster than building it from scratch.
A suite built this way still has one cost that grows with size. The next section covers keeping it trustworthy.
What It Costs to Keep a Large Suite Alive
A large suite comes with costs that have nothing to do with variants. Some tests fail at random on code that hasn’t changed, then pass when you rerun them. These are called flaky tests, and every big suite has them.
Think of a smoke alarm that goes off a few times a week for no reason. After a month, nobody gets up when it rings. A flaky test does the same thing to a build. It turns red, a developer reruns it, it turns green, and the next time it turns red, nobody looks.
The reasons are ordinary, such as a timeout set too short, two tests sharing the same database record, or a device emulator that is slow on Mondays.
At scale, this stops being an annoyance.
Google’s own data, published by John Micco in a post on flaky tests at Google, gives two figures. About 1.5% of all test runs report a flaky result, and almost 16% of all tests show some flakiness over time. With 3,000 tests, 1.5% means roughly 45 false alarms in every full run, and somebody has to check each one.
Micco’s verdict on fixing them is the line worth remembering. He wrote that “the insertion rate is about the same as the fix rate.” Teams add new flaky tests as fast as they fix old ones, so plan for flakiness as ongoing maintenance with a budget, the way you plan for server costs.
The data is from 2016, and there is no credible 2025 or 2026 benchmark to replace it. Vendor pages quote newer percentages, but none of them publish a method or a sample, so treat the Google figures as the only ones with a source behind them.
What flakiness costs is trust. Google’s Software Engineering team puts it plainly. “A bad test suite can be worse than no test suite at all.”
Once developers expect red builds to be noise, they stop reading them, and automated regression testing loses its only purpose.
Here is what we do about it with clients.
- Quarantine instead of deleting. A test that fails twice on unchanged code moves to a separate lane with an owner and a two-week deadline to fix it.
- Cap the retries. One automatic retry, logged. Record a pass on retry as flaky.
- Watch test size. Google’s follow-up research found that larger tests, measured by memory and binary size, are far more likely to be flaky, so long end-to-end scenarios get split before they get fixed.
- Retire on schedule. Every quarter, tests that have not failed in six months and cover code nobody changes are candidates for removal.
Running fewer tests also costs less than most teams expect. Facebook’s predictive test selection halved the infrastructure cost of testing code changes while still reporting over 95% of individual test failures. The savings were in compute time, and the number of tests written stayed the same. The misquote that it “cut tests in half” is everywhere.
A smaller, trusted suite still needs proof that it is doing its job. That proof comes from metrics, and the usual ones mislead.
Metrics That Show Scaling Is Working
Once the suite runs across forty versions, you need a way to tell whether it is catching problems or just producing green checkmarks. The usual dashboard number, the overall pass rate, cannot tell you that. If 39 brands pass and one brand fails every test, the dashboard still shows 98% green, because that brand is only 2.5% of the suite.
The first change is to split every number you already track by version. Pass rate per brand, bugs per device group, failures per country. The brand with the broken checkout then shows up in a week instead of a quarter.
The second change is to swap a few metrics that stop working at scale for ones that keep working. The table shows the swap we ask clients to make.
| Usual Metric | Measure Instead | Why |
| Aggregate pass rate | Pass rate per variant | One broken brand is 2.5% of the total |
| Total test count | Combinatorial coverage, share of pairs touched | Counts tests that matter, ignores duplicates |
| Bugs found in QA | Escaped defects per variant | Measures what customers saw, per brand |
| Mean time to recover | Time to detect per cohort | Slow detection on one device hides in the mean |
| Code coverage percentage | Blast radius per variant | Shows how many customers one failure touches |
Two terms in the table need a plain explanation.
- Escaped defects are bugs that got past testing and reached customers. Count them per brand, and you know which brand your suite is failing.
- Combinatorial coverage is the share of all pairs of settings (brand and device, locale and tier, and so on) that at least one test touched. It replaces “how many tests do we have” with “how much of the matrix do we check.”
The third change is about release speed and safety, and here most articles are out of date. DORA is a research group at Google that has studied how teams ship software since 2014. It measures delivery with five numbers.
- Change lead time. How long a code change takes to reach production.
- Deployment frequency. How often you release.
- Failed deployment recovery time. How fast you recover when a release breaks something.
- Change fail rate. What share of releases cause a problem in production.
- Deployment rework rate. What share of releases exist only to fix a previous release.
Two details date an article instantly. The recovery metric used to be called mean time to recover, and DORA renamed it to count only failures caused by a release. And the 2025 report stopped sorting teams into elite, high, medium, and low, so any claim about what “elite teams” achieve refers to a scale that no longer exists.
For a multi-variant product, track all five per version too. A 3% change-fail rate across the company can hide a 20% rate for one brand.
One number has no outside reference point. No published industry benchmark says how many bugs should escape to production. Every “under 5% is good” figure online traces back to a vendor page without a study behind it. Take your own last two quarters as the baseline and improve against that.
Tracked this way, the benefits of test automation at scale become visible to people outside QA, which is what continuous testing needs to survive a budget review. We cover where these numbers sit in the wider release process in our guide to planning a software release end to end.
Where Experts Still Disagree
Three questions about test automation at scale have no agreed answer, and you will meet all three when you plan your suite. Below is each question with both sides, so you can pick the one that fits your product.
1. What shape should the suite have?
Tests come in three sizes. A unit test checks one small function. An integration test checks several parts working together. An end-to-end test clicks through the whole product the way a user would.
The test automation pyramid says you should have many unit tests, fewer integration tests, and very few end-to-end tests, because end-to-end tests are slow and break often. Two newer models disagree with the pyramid, and the table shows how.
| Model | Who Proposed It | Most Tests Go To | Fits Best |
| Pyramid | Mike Cohn, 2009 | Unit tests | Single products with stable interfaces |
| Trophy | Kent C. Dodds | Integration tests | Frontend apps built from components |
| Honeycomb | Spotify Engineering | Integration tests | Microservices, one service per test |
The trophy argues that most bugs live where parts connect, so integration tests give more confidence per hour. Spotify’s honeycomb makes the same point for backend services. For a multi-variant product, the integration layer is where brand, device, and locale meet, so we lean toward the trophy and honeycomb shapes.
2. Are end-to-end tests worth their upkeep?
J.B. Rainsberger’s talk “Integrated Tests Are a Scam” argues that a test which depends on another system’s correctness cannot be trusted and should be replaced by contract tests. The Playwright and Cypress community argues the opposite. A handful of end-to-end tests on the money paths is the only proof that the product works as a whole.
Both sides agree that end-to-end test automation is expensive. They disagree on whether contract tests can fully replace it. Our practice is a small end-to-end set, under 5% of the suite, on checkout, login, and tenant switching, and contracts for everything else.
3. Do self-healing and record-and-playback tools work?
Two honest verdicts. There is no independent evaluation of AI-based self-healing test tools, and every published result comes from the vendors selling them. The practitioner consensus against record-and-playback tools is strong, while the evidence behind it is thin, because almost all of it is also vendor content.
Martin Fowler’s own note on the test automation pyramid is the right way to hold all of this. “The pyramid is based on the assumption that broad-stack tests are expensive, slow, and brittle compared to more focused tests, such as unit tests. While this is usually true, there are exceptions.”
A product with forty versions is one of those exceptions, because the failures you care about only appear when versions meet.
Theory covered. Here is what it looks like on our projects.
What Scaled Test Automation Looks Like in Practice
Three projects show the ideas above at work. Two clients are under NDA, so they appear by industry only. Every number is quoted as recorded, with its original wording.
| Client | Starting Point | What Changed | Result |
| US construction-technology platform | 5.5 incidents per month, 2 hotfix patches per month | Appium framework live in CI/CD, team of 4 | Incidents cut to 0, hotfixes to zero, $360K annual QA cost exposure addressed |
| Fortune 500 US fashion retailer | Manual regression took 48 hours, full suite ran 2 hours | 3,000+ tests maintained, 75% mobile automation coverage | Regression 8 hours, suite 17 minutes, 98% test stability |
| MasterControl, Validation on Demand | Validation cycles took weeks | Automated validation workflows, team of 3 | Cycles cut to 10 to 20 minutes, 100% of runs produce audit-ready reports |
The construction platform is the clearest example of what “test automation” buys a business. Zero critical errors after migration, and all three mobile tools released successfully on the first attempt, with a team of four people. We describe the setup in our mobile QA acceleration case study.
The fashion retailer is the mobile app testing case from the device axis. A suite of more than 3,000 tests runs in 17 minutes instead of 2 hours, and localization QA turnaround improved by 95%, which is the locale axis paying off. Details are in the Fortune 500 retailer mobile QA case study. MasterControl is two engagements. Validation on Demand has the numbers in the table. The second, an enterprise test automation framework, has no published metrics, so we describe it in words only. It unified static analysis, unit, integration, end-to-end, performance, and backward-compatibility testing under one framework, using Playwright, Gatling, and Sonar in GitHub pipelines, and shifted test ownership to the development teams.
That ownership shift is the same one described in the architecture section, and it is written up in the MasterControl test automation case study.
We collect more projects like this in our QA case studies.
Final Word
Scaling test automation across product variants takes time. You need to list your variables, count how many values each has, admit which ones you have been testing out of habit, and sit through a hard conversation about which brands and devices deserve a test before release and which can go to staged rollout.
But this stage is worth the effort.
A team that knows its floor stops hiring in step with variants, and the fortieth brand ends up costing less to test than the first. A team that skips this step keeps maintaining forty copies of the same suite and learns about the broken brand from a customer support ticket.
Use the Variant Cost Ladder as a starting point, but do not stop there. Multiply your two largest variables, put that number in front of your CTO, and then decide what belongs on which rung before the next release goes out.
If you are looking for a place to start, Zoolatech is ready to review your matrix, check the floor with you, and help you plan how to scale test automation across product variants before development begins.
Questions You May Have
How many device models do we need to test on?
Test the models that cover about 90% of your own users by your analytics, usually 8 to 12 for a US product, and watch the rest through per-cohort crash monitoring after release.
Do we have to test every feature-flag combination?
No, and LaunchDarkly’s documentation calls this a common misconception, because pairwise testing of interacting flags covers the failures that matter with a handful of tests.
What is pairwise testing, and when does it fail?
Pairwise testing runs a small set of configurations in which every pair of settings appears together at least once, and it misses only bugs that need three or more specific settings at the same time, which NIST found to be rare.
How do you test white-label builds without a suite per brand?
Keep one parameterized suite and feed it a per-brand config file, then run it on a golden brand plus the two brands that differ most, with visual regression across themes and contract tests on the backend.
How do we decide what to automate and what to leave manual?
Automate anything that runs on every build or every variant, and keep manual effort for exploratory sessions on new features and for one-off checks that would cost more to script than to click through.
When should a team stop adding tests and start sampling?
Stop the day your two largest variables are covered pairwise, because every test added after that point checks combinations that almost never fail on their own.
What are the benefits of test automation for a product with many variants?
The main benefits of test automation at this scale are a QA cost that stays flat as variants grow, per-variant visibility into which brand or device is broken, and a release cadence that no longer depends on a 48-hour manual regression.
Should every brand use the same test automation framework?
Yes, one test automation framework with variant values loaded from config is the only setup where a fix made for one brand reaches all the others automatically.
How much end-to-end test automation does a multi-variant product need?
Keep end-to-end test automation under about 5% of the suite and focus it on money paths such as checkout, login, and tenant switching, with contract tests covering everything else.