








We continue our series on AI-ready data. Today we look at data readiness for AI: what it is, how to measure it, and what to do with the results.
Data readiness for AI is how well your data fits one specific AI use case. In other words, it shows whether the data you already have is enough for an AI project to work correctly, and what is missing if it is not.
Almost every company we talk to wants to put AI into its business, and most run into data problems on the first project. Usually nobody can say how deep those problems go, so the team argues about it instead of measuring it.
Our guide to AI-ready data explains what readiness means and gives you a quick five-attribute scorecard. This article goes deeper into the assessment itself.
Here we lay out the Zoolatech AI Data Readiness Framework, eight criteria scored from 0 to 3. Then we show how to run the audit, who leads it, how to read the results, what to fix first, and which tools help.
By the end, you will have an AI data readiness profile for one use case, a threshold to compare it with, and a short list of gaps to fix first.
What Is Data Readiness for AI?
We gave a short definition in the intro, and here is the fuller one, because you will use it to decide what to measure and where to stop.
Data readiness for AI means your data has everything a specific AI project needs to work. The data is accurate, complete, up to date, described so a machine can read it, and authorized for that purpose.
There are different ways to measure it, and we share our own method later in this article. Whatever the method, a good assessment shows if the data is good enough for this project and what to fix if it is not. As a result, you stop guessing about the data and get information you can act on before you spend the budget.
Data readiness vs. AI readiness vs. AI-ready data
Two other terms sit next to data readiness, and people often treat all three as one concept. Each answers a different question, and mixing them up leads you to assess something you didn’t mean to assess.
Organizational AI readiness is a much wider question. It asks if the company as a whole can run AI. Is there a strategy, are there people with the right skills, is there a team that can take a model from an idea to production, and is there a budget for it.
AI-ready data is the outcome. It is data that has already been assessed for a use case and cleared the bar so the AI project can start right away.
Two Ways to Run a Data Readiness Assessment for AI: One Use Case or the Whole Enterprise
Before you assess data readiness for AI, decide how broad the assessment will be. There are two modes, and the choice changes the sample, the team, and the timeline.
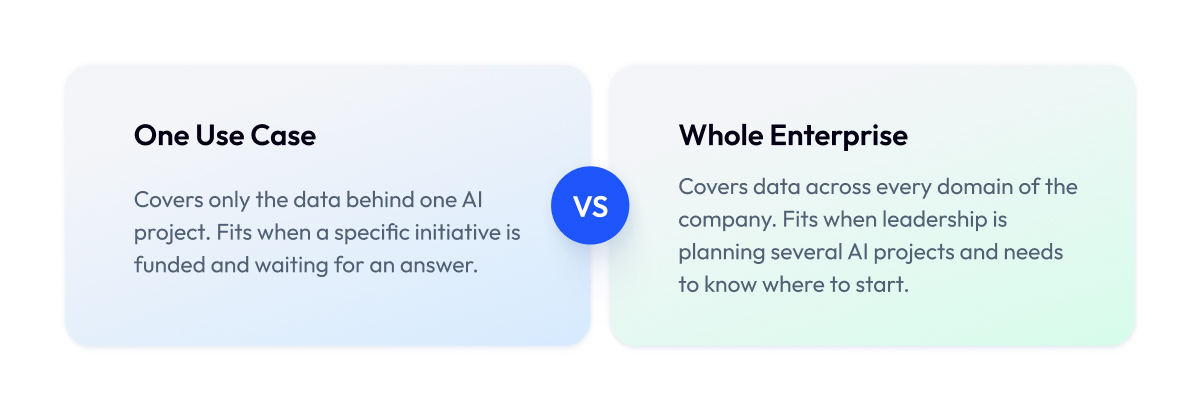
Use-case-scoped means you assess only the data that feeds one project, such as a fraud model or a support assistant. This is how it usually starts in mid-size companies and in a single business unit of a large one, where a funded project needs an answer in weeks. The sample is small, the owners are few, and you can be done in two to three weeks.
Enterprise-wide means you assess enterprise data for AI readiness across all domains, because the company is planning a portfolio of AI projects and wants to see the gaps before it picks them. This is the mode a CDO runs when the board asks where the company stands. It takes owners from every domain, a broader sample, and one to three months, and it produces a heat map instead of a go or no-go for one project.
| Aspect | Use-Case-Scoped | Enterprise-Wide |
| Question answered | Can this data support this project | Where are the gaps across all domains |
| Sample | Tables and sources on the use case path | Representative sample from every domain |
| Team | Data owner, one or two engineers, AI lead | Data leadership plus owners per domain |
| Duration | Two to three weeks | One to three months |
| Output | Score, gap list, go or no-go | Readiness heat map and portfolio roadmap |
Even large enterprises we work with often start with one use case, when they plan to assess company data readiness for AI across every domain later. The first project shows the team how the scoring works and what the results look like. After that, it is much easier to repeat the same assessment in other departments, because everyone already understands the method and trusts the numbers.
Existing AI Data Readiness Frameworks and What They Miss
Before we built our own method, we studied the best data readiness frameworks for AI that already exist. Most of them fall into three groups, and each group has weak spots that make it hard to use for measuring data readiness for AI in a business.
Academic frameworks
These come from universities and research labs. They define readiness levels, such as raw, cleaned, labeled, feature-engineered, and AI-ready, and they measure dimensions like completeness, bias, and provenance with formal metrics. They are the most rigorous option on the market.
Where they fall short:
- They are written for researchers working on one dataset, with no notion of business scope or use case.
- They assume you have time to compute every metric before you start, which no project team has.
- The language is academic, so a CDO cannot take the result to the board without translation.
Organizational readiness assessments
These come from consultancies and analyst firms. They score the whole company on strategy, talent, culture, budget, and governance, usually through a survey, and produce a maturity level for the organization.
Where they fall short:
- Data gets one line out of twenty, so you can score well and still have no idea if your customer table can feed a model.
- The result is an opinion about the company, and there is nothing an engineer can measure or repeat.
Vendor and consulting frameworks
These come from platform vendors and service providers. They focus on the data and are the closest to something practical, because they were built to run on client data.
Where they fall short:
- The scoring rubric stays behind an engagement. You get four high-level steps on a landing page, and the method arrives after you sign.
- Readiness is defined through the vendor’s own feature set, so the assessment doubles as a sales tool for their platform.
| Framework Type | Focus | Measurable | Usable In-House | What It Misses |
| Academic | Data, one dataset at a time | Yes, formal metrics | Rarely, too heavy | Business scope and use case fit |
| Organizational | Company strategy and people | Partly, survey-based | Yes | The data itself |
| Vendor and consulting | Data, tied to a service | Yes, behind engagement | No | Transparent rubric and thresholds |
Even the best AI data readiness frameworks fall short on the same three points. None of them measure the data itself, can be run by your own engineers, and show scoring openly at the same time. We built the Zoolatech AI Data Readiness Framework to close that gap, and the next section walks you through it.
The Zoolatech AI Data Readiness Framework: Eight Criteria Scored 0 to 3
The Zoolatech AI Data Readiness Framework is a scoring rubric for the data behind one AI use case. It checks eight criteria, from basic accuracy to bias and privacy, and scores each from 0 to 3. You get the full rubric below, so your own team can run it, and the result always relates to a specific AI project.
That is where it differs from the frameworks in the previous section. It measures the data itself, which organizational assessments skip. It fits into a two-week audit, which academic frameworks do not. And it shows every check and threshold openly, which vendor frameworks keep behind a contract.
Using the Zoolatech AI Data Readiness Framework takes three steps:
- Give each of the eight criteria a score from 0 to 3, using the rubric below to decide which score fits. A 0 means nobody has addressed this criterion at all, and a 3 means it is solid enough to run production AI on.
- Take only the criteria that matter for the type of AI you are building, since a dashboard and an autonomous agent need different things from the data.
- Add up those scores and compare the total with the maximum possible. For example, if five criteria count for your project, the maximum is 15 points. Our rule from client work is that the data should reach at least 70% of that maximum before the project starts, so 11 points in this case. Below that line, the gaps are big enough to stall the project, and you fix them first.
The output is an AI data readiness profile you can show to an engineer and to the board with the same numbers.
In our general guide to AI-ready data, we wrote that you can assess data on five core attributes. Those five are enough for a quick check. For a full assessment, you can break each one down further. That gives eight criteria, and each one answers a single question about your data.
| Criterion | Question It Answers |
| Quality, completeness | Are the values correct and filled in |
| Structure, accessibility | Can a machine reach and read the data |
| Semantics, metadata | Is the meaning of every field written down |
| Lineage, traceability | Can every record be traced to its source |
| Coverage, representativeness | Does the data cover every production situation |
| Bias, fairness, class balance | Will the data skew the model |
| Privacy, PII, compliance | Is sensitive data mapped, masked, allowed |
| Freshness, observability | Is the data fresh, are breaks detected |
The criteria fall into four groups. For each one, here is what it is, why it matters, where to look, and how to score it.
Data fundamentals
1. Quality and completeness
What it is: the criterion responsible for the basic correctness of your data. It checks that every value is right and every required field is filled in.
Why it matters: an AI model learns from the data exactly as it is. If the values are wrong or missing, the model learns wrong and missing. All the other criteria rely on this one.
Where to look: the tables your project will use. Compare a sample of records with the source system, count the empty fields, and ask the team how they find errors today.
How to score it:
- 0: your users find the mistakes.
- 1: your team knows about the mistakes and fixes them by hand.
- 2: a system checks the main tables automatically.
- 3: every table the project uses is checked automatically.
For a Fortune 500 retailer, this was the first thing we fixed, replacing several conflicting reports with one set of numbers everyone trusted.
2. Structure and accessibility
What it is: a check of how easily a program can reach your data. It covers two things: whether the data can be read without a person in the middle, and whether all the data the project needs is in one place.
Why it matters: if someone exports a spreadsheet by hand every week, the AI depends on that person. If customer data is split across five systems, the AI sees only part of the customer.
Where to look: the list of systems that hold data for your project. Ask how the data gets from each system into the place where the model will read it, and whether a person is involved.
How to score it:
- 0: data comes out through manual exports only.
- 1: some systems have a connection, most do not.
- 2: most data is in one place, with some gaps.
- 3: all the data the project needs sits in one place a program can read.
For Pandora, we connected around 100 separate systems into one, and only after that could the rest of the assessment start.
Machine interpretability
3. Semantics and metadata
What it is: this criterion is responsible for whether a machine can understand what your data means. It checks that the meaning of every field and every document is written down in a form a program can read.
Why it matters: a column called “status” with the value 3 means nothing to a program until someone writes down that 3 means “shipped.” For documents, the program needs to know which version is current.
Where to look: your data catalog, if you have one, and the descriptions of the tables your project will use. If the only way to learn what a field means is to ask a colleague, you have found the gap.
How to score it:
- 0: the meaning lives only in people’s heads.
- 1: some of it is written down, but out of date.
- 2: the main tables are described in a catalog.
- 3: every field is described and kept up to date.
4. Lineage and traceability
What it is: the criterion that covers the history of your data. It checks that every piece of data has a trail showing where it came from and how it changed on the way.
Why it matters: when the AI gives a wrong answer, you follow the trail back to the source to fix it, the same way you trace a wrong invoice back to the order. In regulated industries, keeping this trail is also a legal requirement.
Where to look: your data pipelines and the tools that run them. Pick one number from a report and ask the team to show you the exact source record it came from. How long that takes is your answer.
How to score it:
- 0: nobody can trace a record to its source.
- 1: it can be done by hand, slowly.
- 2: the main data flows record their history.
- 3: every record can be traced automatically from source to output.
AI-specific risk
5. Coverage and representativeness
What it is: a check that your data includes every situation the AI will meet in real life, including rare cases and seasonal patterns. This criterion ensures the model has seen enough before it goes live.
Why it matters: a model can only learn from what it has seen. If your sales data skips the holiday season, the model works all year and fails in December. Data readiness for generative AI depends on the same thing, and it also covers documents, contracts, and support chats.
Where to look: the time range and the variety of records in your training data. Compare them with the list of situations the project has to handle, and note what is missing or rare.
How to score it:
- 0: you do not know what is missing.
- 1: you know what is missing, but have not measured it.
- 2: you measured it and closed the main gaps.
- 3: the data covers every situation the project will face.
For Rue Gilt Groupe, we built text and image processing for more than 50 million members, and checking what the data covered was the first step.
6. Bias, fairness and class balance
What it is: this criterion is responsible for the data teaching the model the right lesson. It checks that outcomes and customer groups in the data are balanced and that none are missing or drowned out.
Why it matters: if only 1 transaction in 1,000 is fraud, a model trained on that data learns to say “no fraud” every time and looks 99.9% accurate while catching nothing. The same happens when one customer group is missing from the data. Regulators now ask about this.
Where to look: the share of each outcome and each customer group in your training data. Compare those shares with real life and with what the model has to detect.
How to score it:
- 0: the balance has never been checked.
- 1: it was checked once.
- 2: it is checked before every release.
- 3: it is monitored continuously, with limits that stop the project when crossed.
Governance and operations
7. Privacy, PII and compliance
What it is: the criterion that covers personal and sensitive data. It checks that you know where this data is, who may use it, and that it is protected before the AI sees it.
Why it matters: an AI that reveals salaries or health records is a legal problem, and the customer’s permission has to be valid at the moment the AI makes its decision. The rules come from laws such as GDPR, HIPAA, and the EU AI Act.
Where to look: your list of tables with personal data, the access rules on them, and how consent is stored. If no such list exists, that is the score.
How to score it:
- 0: nobody knows where the personal data is.
- 1: it is mapped, but the rules are informal.
- 2: it is masked, and consent is tracked.
- 3: the rules are enforced automatically at the source and can be audited.
For Pandora, that meant masking personal data at the source for more than 5,000 users, and for Zalando, checking consent inside the live data flow.
8. Freshness and observability
What it is: a check of speed and monitoring. This criterion ensures the data reaches the AI as fast as the decision needs, and that someone finds out when a source stops working.
Why it matters: a monthly report can run on yesterday’s data, while a fraud check cannot. And if a data feed breaks on Friday night, you want an alert on Friday night, before the model spends the weekend deciding on old numbers.
Where to look: each data source’s update schedule and your pipeline monitoring. Ask when the last failure happened and how the team found out about it.
How to score it:
- 0: the data is updated when someone remembers.
- 1: it runs on a schedule, but nobody is alerted when it breaks.
- 2: the speed matches what the decision needs, and basic alerts exist.
- 3: the data is real-time where it needs to be and fully monitored.
For Zalando, we cut analytics delay across web, iOS, and Android from up to 90 minutes to near real time.
The table below puts all eight criteria in one place, so you can score each criterion that applies to your project without scrolling back through the descriptions.
| Criterion | What to Check | 0 | 1 | 2 | 3 |
| Quality, completeness | Accuracy, required fields | Users find errors | Errors known, fixed manually | Automated checks on key tables | Automated checks everywhere |
| Structure, accessibility | Formats, APIs, system sprawl | Manual exports only | Some APIs, many silos | Central layer, gaps remain | One governed layer, machine access |
| Semantics, metadata | Field meaning, catalog | Meaning in people’s heads | Partial docs, out of date | Catalog for key tables | Every field described, versioned |
| Lineage, traceability | Source of every record | Nobody can trace | Traced by hand, slowly | Lineage on main pipelines | Automated end-to-end lineage |
| Coverage, representativeness | Rare cases, seasons, unstructured | Unknown gaps | Gaps known, not measured | Measured, main gaps closed | Covers every production situation |
| Bias, fairness, class balance | Class, group distribution | Never checked | Checked once | Checked per release | Monitored, thresholds enforced |
| Privacy, PII, compliance | PII map, consent, masking | PII location unknown | Mapped, rules informal | Masked, consent tracked | Enforced at source, auditable |
| Freshness, observability | Latency, drift alerts | Updated when remembered | Scheduled batch, no alerts | Latency matched, basic alerts | Real-time where needed, full monitoring |
Now that you know the eight criteria and the scores, the next section shows how to run the assessment itself, from choosing the data to writing the report.
How to Run a Data Readiness Assessment for AI: Steps, Roles, and Timing
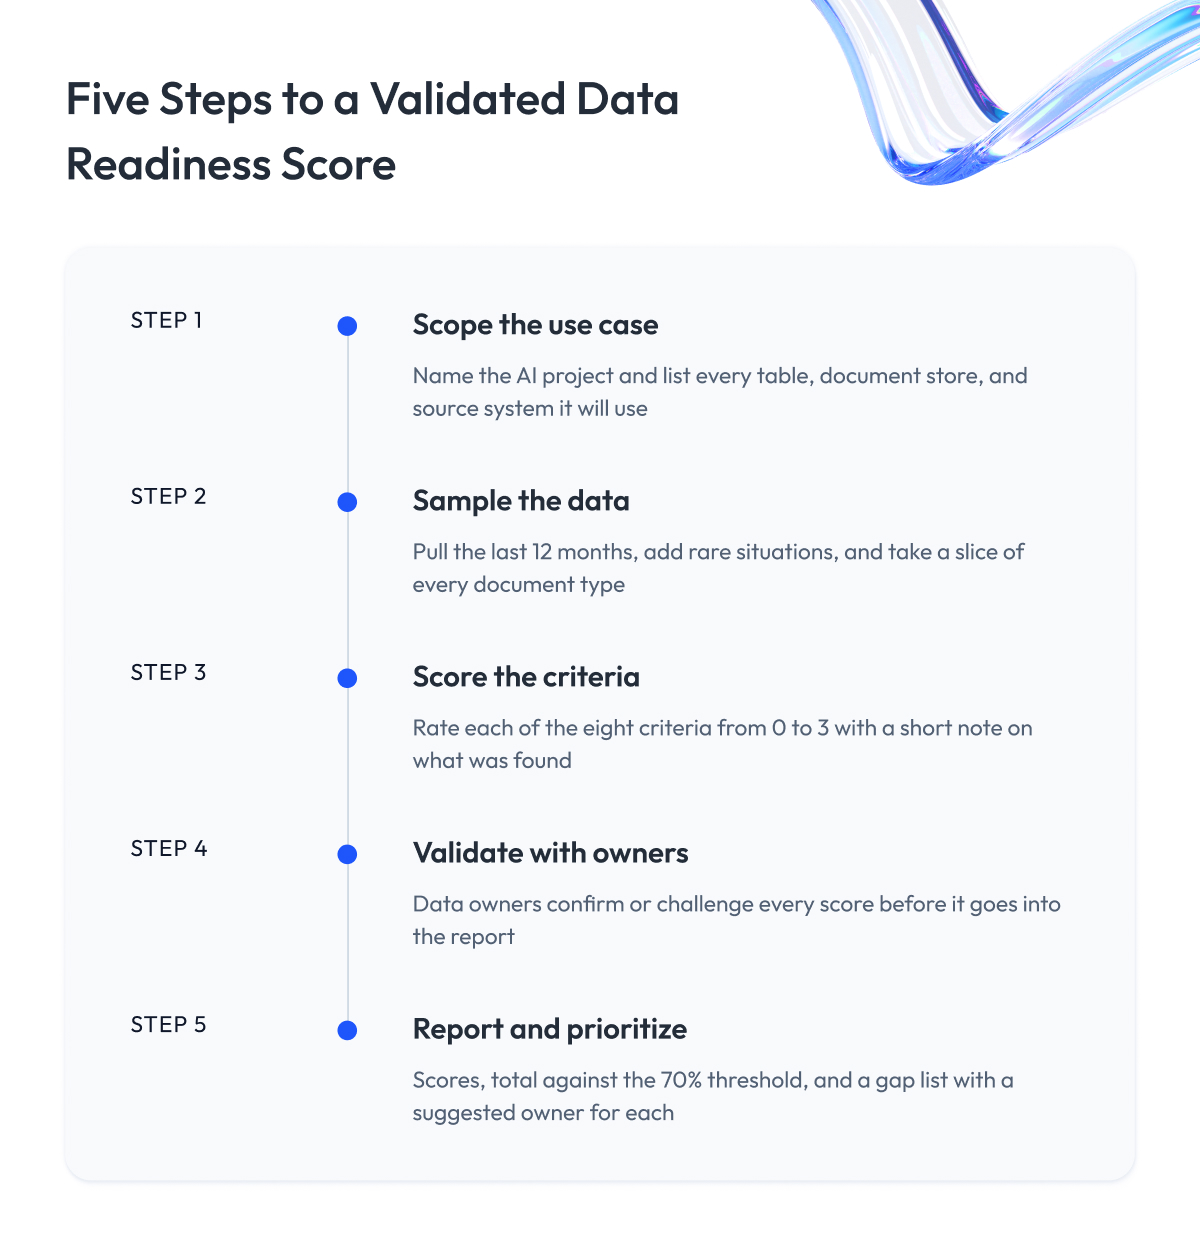
Eight criteria with four possible scores each and a threshold to hit can look like a lot of work, and the first question is usually where to start. We have run this assessment with many enterprise clients, and below is the simple five-step process we use. For one use case, it takes two to three weeks and a small team.
Step 1 – Define the scope and pick the use case
Start by naming the AI project you are assessing, such as a demand forecast for one product line or a support assistant for one department. Then sit down with the AI lead and list every table, document store, and source system that the project will use.
Write the list down, because it becomes the assessment boundary. Anything outside it does not get scored, no matter how messy it is. At this point, also decide which of the eight criteria matter for this type of project, so the engineer knows where to spend the most time.
Step 2 – Pull a sample of the data
You do not need every record to score the data, and trying to check everything is the fastest way to never finish. A sample that fits on a laptop is enough to score all eight criteria.
What goes into the sample:
- The last 12 months from every table on your list.
- The rare situations the project has to handle, such as returns in December or a fraud spike.
- For documents, a slice of every type the AI will read, including old versions, so you can see how well they are labeled.
Step 3 – Score each criterion
An engineer goes through the scoring table from the previous section and gives each criterion a score from 0 to 3. This step usually takes a few days, since the table already says what to look for.
For every score, the engineer writes a short note on what they saw, for example, “field meanings for 3 of 11 tables documented, the rest undocumented.” These notes matter as much as the numbers, because they turn a score into a task later on.
Step 4 – Validate the scores with the data owners
Take the scores and the notes to the people who own each table and ask them to confirm or challenge every number. Some scores will go up because the owner knows about a check the engineer missed. Some will go down because the owner admits the documentation is older than it looks.
Teams often skip this step to save time, and it is the one that makes the result stick. A score the data owner has signed off on cannot be dismissed in the next budget meeting.
Step 5 – Write the report
Keep the report to two pages. This document goes to the board and becomes the starting point for the roadmap.
What goes into the report:
- The score for each criterion, with the engineer’s note next to it.
- The total for the criteria that matter for this project, compared with the 70% threshold.
- The list of gaps, meaning every criterion that matters for the project and scored 0 or 1, each with a suggested owner.
Here is who does what.
| Role | What They Do | Time Needed |
| Data owner | Leads, confirms scores, signs the report | Several hours across two weeks |
| Data engineer | Pulls the sample, scores the criteria | Five to eight working days |
| AI or ML lead | Defines the use case, sets which criteria matter | Two to three hours |
| Business stakeholder | Validates coverage and meaning against real processes | Two to three hours |
| IT or security | Grants access, reviews the privacy score | One to two hours |
The last question is when to do all this. The best moment is after you have chosen which AI project to build and before its budget is approved. Before that, you have no project to measure the data against. Later than that, you will find the gaps when the money is already spent on the model.
If your team has never done this before, you can run the first assessment with AI consultants for a data readiness assessment or an engineering partner. Companies that offer data readiness consulting for enterprise AI, including us, usually finish the first one in two weeks and leave the method with your team for the next.
Reading the Results: Readiness Levels and Thresholds
This section turns your scores into a percentage and a readiness level, so you can see how far your data is from ready.
Add up the scores for the criteria you chose for your project and divide the total by the maximum, which is 3 points per criterion. Five criteria give a maximum of 15, six give 18, and all eight give 24. The result is your readiness percentage.
Here is an example. You are building a fraud model and chose four criteria: quality, semantics, coverage, and bias. They scored 3, 1, 2, and 1, which gives 7 out of 12, or 58%. The two criteria that scored 1 are the gaps to fix before training starts.
The percentage tells you your data’s readiness level.
| Score | Readiness Level | What It Means |
| Below 40% | Not ready | Fix the data before any model work |
| 40% to 69% | Partially ready | Close the 0 and 1 gaps first, then start |
| 70% to 89% | Ready for this use case | Start the project, fix remaining gaps in parallel |
| 90% and above | Production grade | Data can serve this and the next use cases |
You can start a project on partially ready data and fix the gaps as you go. Some teams do, when the deadline leaves no choice.
In our experience, it is harder and more expensive than fixing the data first, because every gap you skip comes back as a model that needs retraining, an answer nobody can explain, or a launch that legal puts on hold. Closing the 0 and 1 gaps before the project starts is the cheaper path in almost every case.
From Score to Roadmap: What to Fix First
The report gives you a list of gaps, and the rule for turning it into a roadmap is simple. Fix only the gaps that block the project you are about to start, and put everything else in a backlog. Trying to clean up the whole company’s data first is how AI programs turn into multi-year projects that never ship anything.
To order the gaps, ask two questions about each one:
- Does it block this project?
- How many future projects would it unblock?
Put a gap that blocks the current project first. Among the rest, the one that helps the most future projects goes next. Semantics and lineage usually rank high on the second question, because every AI project needs them.
Here is the roadmap for the fraud model example from the previous section.
| Gap | Priority | Owner | Timeframe |
| Semantics scored 1, transaction fields undocumented | Now, blocks the model | Payments data owner | Three weeks |
| Bias scored 1, fraud cases 0.1% of sample | Now, blocks the model | ML lead | Two weeks |
| Lineage scored 2, manual tracing on two feeds | Next, helps every future model | Data engineering | Six weeks, in parallel |
| Freshness scored 2, nightly batch only | Backlog, fraud model runs on daily data | Data engineering | Next quarter |
Each row has an owner and a timeframe, which is what makes it a roadmap instead of a wish list. When the first two rows are done, re-score the two criteria, and the fraud model can start.
When to Re-Run the Data Readiness Assessment and What to Monitor Continuously
Your data readiness for AI score is valid only on the day you measured it, because data changes every day after that. So this section explains when you need to re-run the assessment and which criteria to monitor continuously.
Re-score the criteria that matter for your project after any of these events:
- A new data source is added, or an old one changes its format.
- The model is retrained or replaced.
- A new regulation applies to the data, such as a new phase of the EU AI Act.
- The use case changes, for example, a support assistant that starts handling refunds.
Three criteria drift on their own, without anyone changing anything, and these should be monitored continuously:
- Freshness, because a feed slows down or stops and nobody notices until the model is wrong.
- Lineage, because a pipeline gets rebuilt and loses its history.
- Privacy, because a new table with personal data appears and nobody adds it to the rules.
Watching these three all the time is what data observability for AI readiness means in practice. After the second or third round, you can see which criteria improve, which keep slipping, and where the company needs to invest.
Tools That Help With the Assessment and What They Won’t Do
You can do the whole assessment by hand, and for one use case that works. There are also tools that make parts of your job easier, especially the scoring and the re-scoring, because you do not want to sample and check the same tables by hand every quarter.
Four categories of AI data readiness assessment tools cover most of the criteria you will score:
| Tool Category | What It Measures | Examples | What Stays Your Decision |
| Data quality and profiling | Errors, empty fields, duplicates, class balance | Great Expectations, Soda, Anomalo, dbt tests | What counts as an error for your project |
| Data catalog | Which fields are described, which are not | Collibra, Alation, Atlan, Microsoft Purview | Writing the meanings in |
| Data observability | Freshness, pipeline failures, lineage | Monte Carlo, Bigeye, Acceldata, Sifflet | Which delays matter for your decisions |
| Privacy and PII discovery | Where personal data sits, who accesses it | BigID, OneTrust, Immuta, Privacera | Your rules, your owners, your consent policy |
Customer data governance tools for AI readiness, such as Purview, Collibra, or Immuta, usually combine the last three categories in one product. They find your personal data, track where it flows, and show who touched it, covering much of the privacy and lineage criteria. They still do not decide what you are allowed to do with it.
Every tool in this table has the same limit. It can measure, but it cannot judge. For example, a tool will tell you that 40% of your fields have no description. It will not tell you if that is a problem for your project, or what score to give it. Only your team can answer that, because only your team knows what the project needs. So the tools save you time on measurement, and scoring stays your job.
If you want help choosing or setting up these tools, that is part of our data analytics services, and we work with whatever platform your data already lives on.
The Assessment Template: A Scoring Sheet You Can Copy
This is the sheet where you record the assessment. Copy it into a spreadsheet to make it your AI data readiness assessment template. The engineer fills in the score and the evidence, the data owner signs each row, and the gap and fix columns get filled in when you build the roadmap.
The criteria are already in the first column, so you only add your own values. If a criterion does not count for your project, leave its score empty and skip it in the total.
| Criterion | Counts | Score (0–3) | Evidence | Owner | Gap | Fix and Timeframe |
| Quality, completeness | ||||||
| Structure, accessibility | ||||||
| Semantics, metadata | ||||||
| Lineage, traceability | ||||||
| Coverage, representativeness | ||||||
| Bias, fairness, class balance | ||||||
| Privacy, PII, compliance | ||||||
| Freshness, observability | ||||||
| Total for criteria that count | ||||||
| Maximum possible | ||||||
| Readiness percentage |
What goes in each column:
- Counts: yes or no, depending on the type of AI you are building.
- Score: 0 to 3 from the scoring table.
- Evidence: one line on what the engineer saw, for example “3 of 11 tables documented.”
- Owner: the person who confirmed the score.
- Gap: filled in only if the score is 0 or 1 and the criterion counts.
- Fix and timeframe: filled in after the roadmap discussion.
Save a copy of every round you run. The history across rounds shows the board whether your data is improving.
Final Word
Assessing data readiness for AI across a large enterprise takes effort, and it is tempting to put it off until the board approves the first AI program. That is the most expensive moment to start.
AI has moved from pilots to something your competitors are already running in production. When your program gets the green light, several business units will want their data ready at once, and that is when the enterprise discovers what it has been living with for years. Dozens of source systems with three versions of the same customer, fields that only a few veterans can explain, personal data spread across regions with different rules. Fixing all of that under a program deadline takes quarters, pulls senior people off their core work, and turns the AI roadmap into a data cleanup project.
Every month adds more systems, more sources, and more undocumented fields, so the data estate you need to control keeps growing and getting harder to keep in order. An assessment that takes a few weeks today takes longer next year.
So start now, even without a program on the table. Pick the use case one business unit is most likely to build first, score its data, and hand the owners a short list of gaps to close. When the program is approved, the data for the first project will be ready, and the same method will scale to the other units.
And if you would rather have experts handle it, we can run the assessment for you, score your data against the use case, and deliver a report with a roadmap your leadership can act on.
Questions You May Have
How is data readiness different from AI readiness?
AI readiness covers the whole organization, including strategy, skills, and budget, while data readiness covers only the data and asks if it can support a specific project.
What criteria should a data readiness assessment cover?
A full assessment covers eight criteria, which are quality and completeness, structure and accessibility, semantics and metadata, lineage and traceability, coverage and representativeness, bias and class balance, privacy and compliance, and freshness and observability.
How do you score data readiness?
Score each criterion that matters for your project from 0 to 3, add the scores, and compare the total to the maximum, aiming for at least 70% before the project starts.
Should we assess one use case or the whole enterprise?
Start with one use case if you are shipping a specific project, and go enterprise-wide only when you are planning a portfolio and need a map of gaps across departments.
Who should lead the assessment?
The data owner leads it, a data engineer scores it, the AI lead defines the use case, and business stakeholders validate the results.
How long does a data readiness assessment take?
A use-case-scoped assessment takes two to three weeks, and an enterprise-wide one takes one to three months depending on the number of domains.
What are data readiness levels?
Readiness levels translate your percentage score into a verdict, with below 40% meaning not ready, 40% to 69% partially ready, 70% to 89% ready for this use case, and 90% or more production grade.
How do you assess AI readiness of company data across many departments?
Run the same eight-criteria assessment in one department first, then repeat it domain by domain with local data owners so every department is scored on the same scale.
Does retail data readiness for AI differ from ERP data readiness for AI?
The criteria are the same, but retail data usually fails on structure because customer data is split across channels. In contrast, ERP data usually fails on semantics because only a few experts understand field meanings.
Do AI data readiness tools with governance built in replace the assessment?
No, tools such as catalogs and PII discovery platforms measure the criteria faster, but your team still decides what score a finding deserves and whether it blocks the project.
Is data readiness for AI analytics the same as for agentic AI workloads?
No, analytics can tolerate gaps in freshness and lineage because a person reads the output, while agentic AI workloads act on their own and need all eight criteria at production level.
When does it make sense to use data readiness services for AI implementation?
Bring in AI data readiness consulting when your team has never run an assessment, when the scope spans many domains, or when you need to prove data readiness for AI adoption to the board on a deadline.