








Quick Summary
- Uber’s ML platform handles 15M+ real-time predictions per second, supporting 5,000+ models.
- Michelangelo provides a shared platform for model training, deployment, and monitoring.
- Data improvements reduced training-serving mismatch from over 10% to 0% and improved data freshness.
- AI initiatives cut invoice handling time by 70%, search latency by 50%, and CI resource use by 53%.
- Uber’s approach shows that scaling AI requires reliable infrastructure, trustworthy data, and human oversight.
At peak, Uber’s machine learning platform serves more than 15 million real-time predictions a second. Uber reported that figure in October 2025. Eighteen months earlier, the same platform reported 10 million.
Nine years before that, Uber’s engineers described a company where models were trained on laptops, every team built its own serving path, and almost nothing reached production reliably.
The throughput is what shows. The decisions underneath it are what transfer.
Those decisions produced narrower results that Uber publishes with the denominator attached:
- Average invoice handling time fell 70% in the finance workflow that uses GenAI extraction
- Uber Eats cut search latency in half
- Training-serving mismatch on affected ranking features fell from more than 10% to 0%
None of these is one program. Uber reports them as separate initiatives with separate owners and dates. Read together, they show a company that made AI useful by rebuilding the systems around it: one route to production, data that can be trusted, and automation that stops where a reviewer should start.
The Problem: A Company That Could Predict Faster Than It Could Ship
In 2017 Uber published the reasoning behind Michelangelo, its machine learning platform. Before it existed, there was no system for building and deploying models reliably at scale. Data scientists used whatever tools they preferred, from R to custom one-off systems. Engineers wrote bespoke serving containers for each project. Nothing was shared, and nothing was reused.
Scale made the gap expensive. By 2024 Uber ran one of the largest Hadoop installations in the world, more than an exabyte across two regions, and its batch platform served more than 500,000 Presto queries a day for over 10,000 internal users.
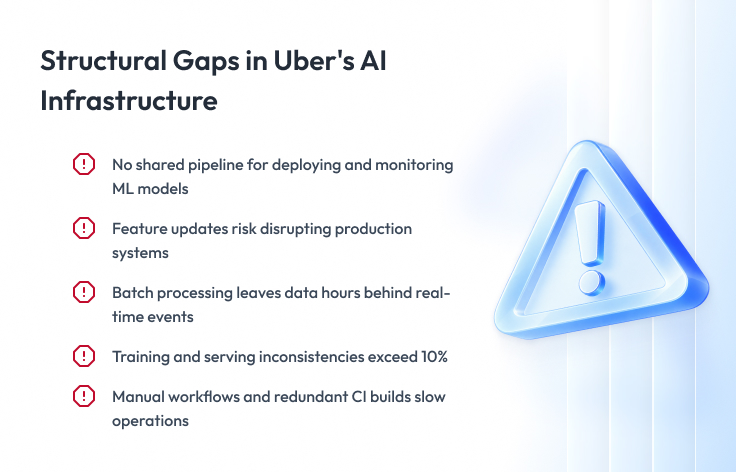
The data existed. The problems sat in the path between data and a decision:
- No shared route to production: every model needed its own pipeline, serving code, and monitoring.
- Fragile change: in 2021 a bad feature-metadata update caused a production serving incident.
- Stale data: scheduled Spark batches left data-lake tables hours behind the events they described.
- Training-serving skew: training pipelines used “en-US” while serving sent “en”. Mismatch on key features exceeded 10%.
- Manual work at the edges: supplier invoices were keyed by hand, and CI ran between 3.4 and 5.4 builds for every change that landed.
Uber had the data and the models. What it lacked was a way for a model to reach production, stay correct once there, and change a real workflow. So it built that path first, then measured each use case on its own terms.
What Uber Delivered
Uber’s engineering blog is unusually detailed. Read in date order, the posts form one dependency chain rather than a portfolio of pilots.
| Period | What Uber delivered | Why it mattered |
| 2016 | Apache Hudi created for incremental updates to the data lake | Made the lake updatable, not append-only |
| 2017 | Michelangelo: one workflow for data, training, evaluation, deployment, and monitoring | First common route from model to production |
| 2018 | Ownership model: product teams own models, platform team owns tooling | Scaled ML without a central bottleneck |
| 2021–2022 | Palette rebuilt after a serving incident; DeepETA hybrid arrival-time model | Safe change became a platform feature |
| 2023 | Google Cloud and Oracle agreements; migration off own data centers begins | Elastic capacity for training and serving |
| 2024 | 10 million predictions a second at peak, 5,000+ models; GenAI Gateway at 16 million queries a month | Predictive scale and governed LLM access |
| 2025 | Marketplace RL; TextSense invoices; SubmitQueue CI; uReview; IngestionNext; shadow testing and 15 million predictions a second | AI inside workflows, with measured deltas |
| 2026 | Feature logging at 0% mismatch; Eats search latency halved; MCP Gateway; 70%+ of pull requests attributed to agents | Consistency, speed, and agent governance |
Seven capabilities came out of that sequence. Each depends on the one below it.
| Layer | Capability | What it does |
| Infrastructure | Hybrid footprint, 306 PB migrated to the cloud | Gives training and serving elastic capacity |
| Data lake | Hudi tables with streaming ingestion, 10 PB ingested a day | Keeps tables minutes behind events, not hours |
| Feature layer | Palette feature store, feature logging at inference | Serves 20,000+ features and trains on what production saw |
| ML platform | Michelangelo with shadow testing and auto-rollback | Deploys 5,000+ models on one path |
| Decision systems | Marketplace value function, DeepETT traffic forecasts, Eats search | Turns predictions into dispatch, routing, and ranking |
| Workflow GenAI | TextSense, uReview, Genie | Drafts, extracts, and reviews inside a human-checked workflow |
| Agent layer | GenAI Gateway, MCP Gateway, agent skills | Gives agents governed access to models and tools |
How Uber Built It
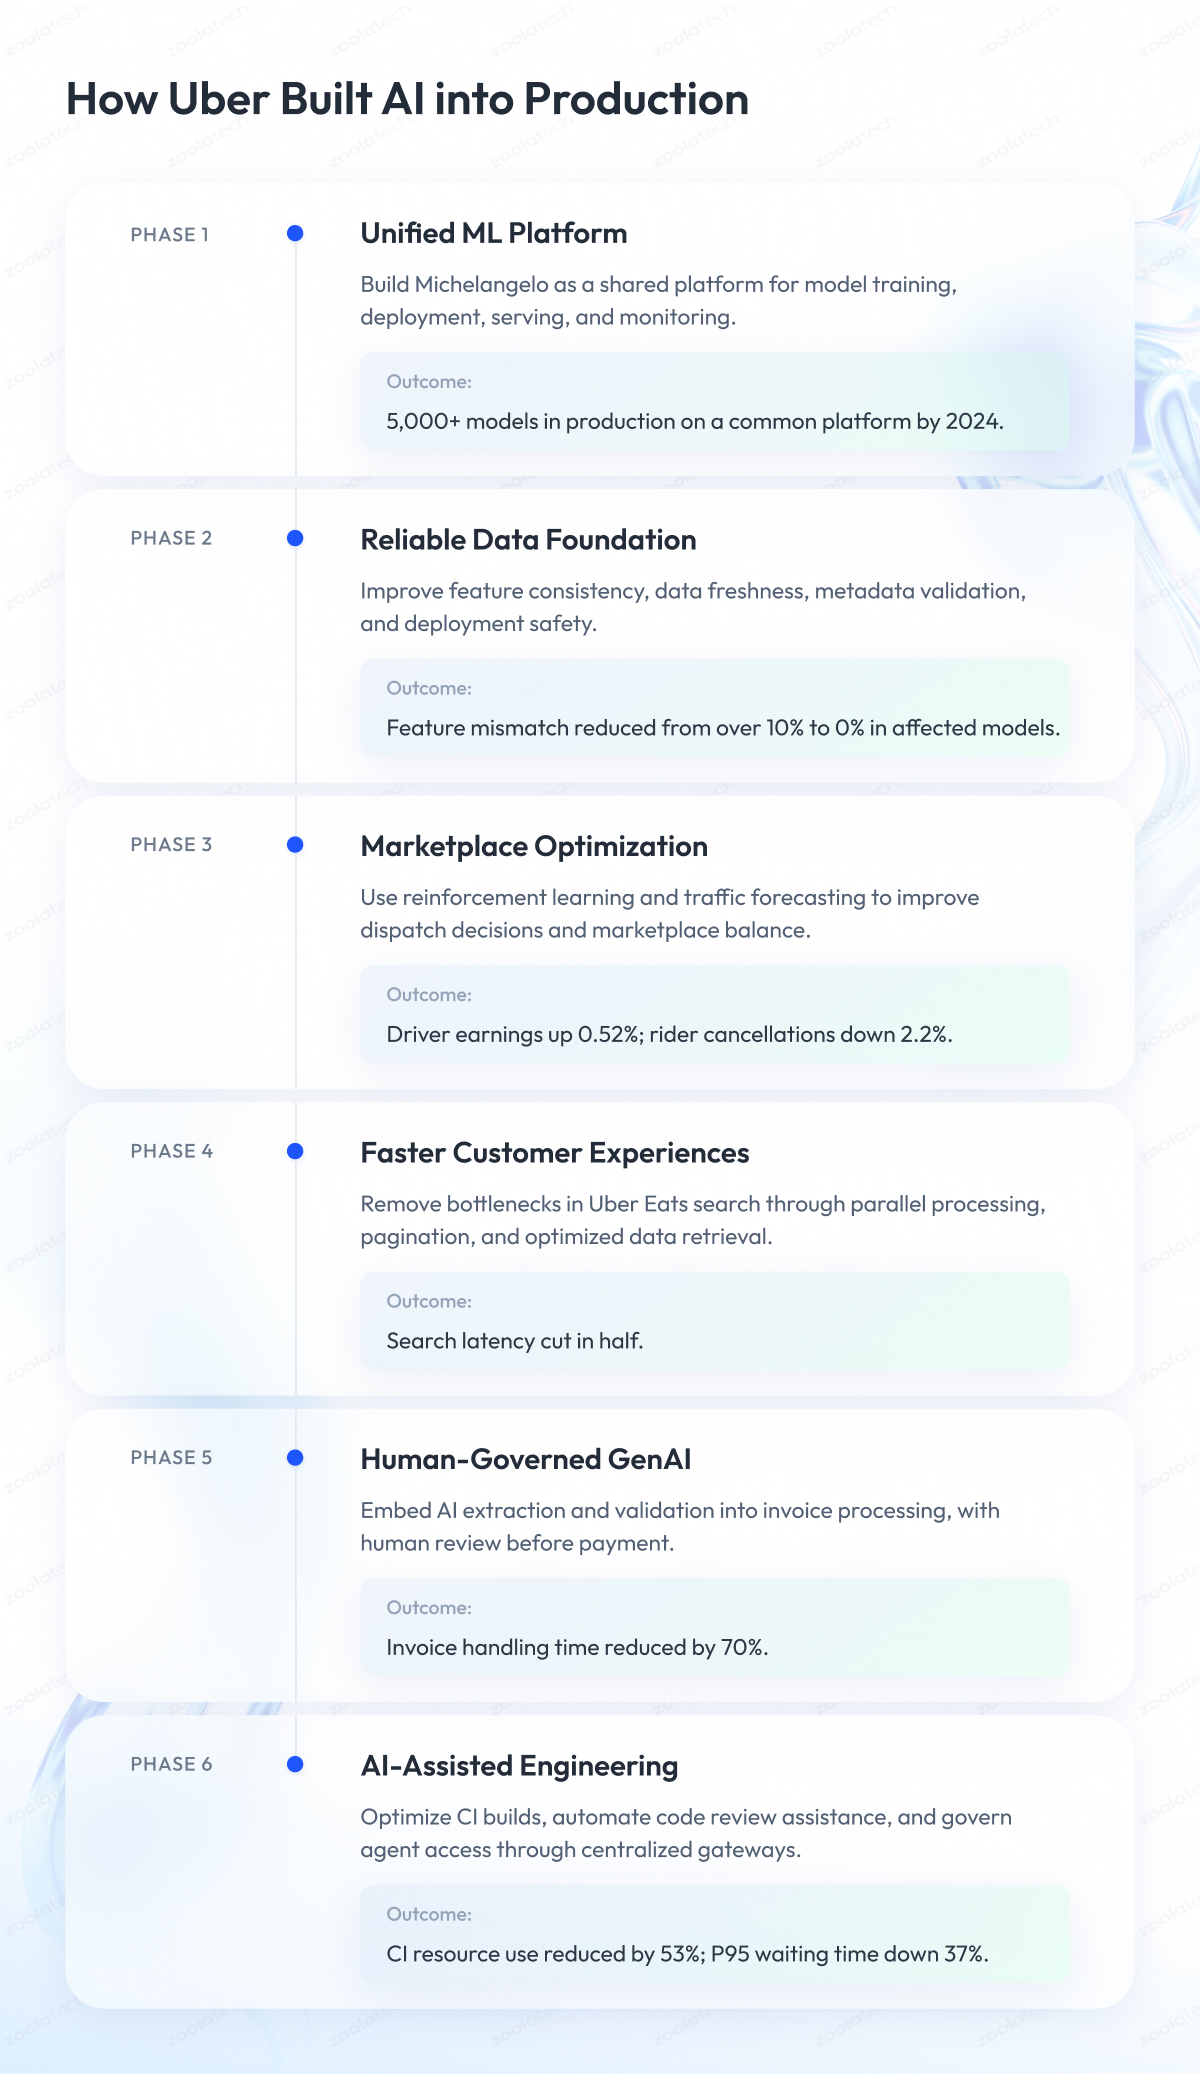
Six stages. In each one Uber had a cheaper or safer option. The decision it made instead is the part worth copying.
Stage 1: Build one route to production, then decide who owns it
The harder decision came a year later, when Uber set out who owns what:
- Product teams own the models they run in production
- The platform team owns Michelangelo itself, the workflow and tools
- Specialist teams in NLP, vision, and forecasting join product teams for weeks or quarters
- Research teams never own production code
By May 2024 that one platform carried about 400 active projects, 5,000+ models, 20,000+ training jobs a month, and 20,000+ shared features. These are adoption figures, not returns.
| Foundation decision | Alternative Uber rejected | Consequence |
| One platform for the full ML lifecycle | Let each team keep its own tooling | 5,000+ models on a common serving path by 2024 |
| Product teams own production models | A central ML team owns every model | Hundreds of practitioners ship without a central queue |
| Shared feature store | Features recomputed per project | 20,000+ features reused across models |
Stage 2: Make the data dependable before making the models smarter
Three data problems, three teams, three years. Uber reports them separately, and so does this article.
Safe change. Palette is Uber’s feature store, the catalog of inputs models read. After a bad metadata update broke serving in 2021, Uber rebuilt it with server-side validation, incremental updates, and rollback. A change now reaches production in 15 minutes, not an hour-plus (January 2024).
Freshness. IngestionNext replaced nightly Spark batches with Kafka and Flink streaming into Apache Hudi, the table format Uber created in 2016. Tables are now minutes behind events, not hours, on 25% less compute (December 2025).
Consistency. Training and serving computed features differently, so models learned from data production never saw. The fix: log the exact features each model consumed and train on those logs. On the search and ranking models that got it, mismatch fell from over 10% to 0% (September 2026).
Above all three: shadow testing. A new model sees live traffic and logs its answers without serving them. By October 2025 it covered 75% of critical use cases, with auto-rollback when errors or latency spike. Regressions surface in hours, not days.
Stage 3: Optimize the marketplace, not the match
Matching a rider to the nearest driver is the obvious objective. Uber decided it was the wrong one: the best match now can leave drivers idle an hour later.
Its July 2025 answer is a learned value function, a model that prices what each driver position will be worth later and feeds that into matching. Completed trips count as reward. Idle time counts as zero.
Tested with switchback experiments, which flip the policy on and off over time across the whole marketplace: driver earnings up 0.52%, rider cancellations down 2.2%. Both relative, with no published duration or confidence interval.
Traffic followed the same logic. DeepETT, May 2026, forecasts traffic on 100 million road segments, 2 million forecasts a second. In a global A/B test, long-trip arrival accuracy improved 6% and navigation defects fell 2.73%. The $100 million a year Uber also cites is an estimate, tabled as one below.
Stage 4: Remove work from the path the customer sees
Uber Eats search was measured by API response time. In September 2026 the team called that the wrong number: the API can get faster while the user still waits for the screen.
The new metric is above-the-fold completion, the time from query to a fully drawn first screen. Then the team cut work along that path instead of tuning the model at the end of it: paginate and render concurrently (200+ ms), drop retrieval paths that rarely returned results (120 ms, no conversion loss), fetch ranking and display data separately (100+ ms).
Overall, search latency was cut in half. The parts do not sum to that, because paths overlap. AI appeared only as an engineering tool, in a measure-fix-validate loop. The result came from architecture, not a better model.
Stage 5: Put GenAI inside a bounded workflow with a reviewer
Supplier invoices arrive as PDFs in every layout imaginable. TextSense, Uber’s document-processing platform, extracts the fields with OCR and AI models. Business rules check them, a human reviews them beside the original PDF, and only then does the invoice reach the ERP for payment.
The model is one step in five. That is why the results keep their units.
| Invoice workflow, April 2025 | Figure |
| Average handling time | Down 70% |
| Processing cost against the manual process | 25 to 30% lower |
| Overall extraction accuracy | 90%, measured on header and line fields with exact or fuzzy matching |
| Invoices at 99.5% accuracy | 35% of submitted invoices |
Ninety percent accuracy does not mean 90% of invoices were right end to end, or that no human touched them. Full automation for reliable suppliers was a next step, not a result.
Uber also publishes where GenAI failed. Migrating 600,000+ JUnit 4 tests (Java unit tests) with generative AI did not work. OpenRewrite, a rule-based rewriting tool, migrated 75,000+ test classes in 4 months, with AI kept for debugging.
Stage 6: Point prediction and feedback at the delivery pipeline itself
Uber then turned the same methods on its own engineering.
Continuous integration. SubmitQueue, Uber’s merge queue, used to run speculative builds for every ordering of pending changes. The redesign predicts each build’s duration with an NGBoost model, runs only the builds likely to be needed, and lets small changes skip ahead.
| Repository | Builds per change, before to after | Weekly CPU hours, before to after | P95 wait in minutes, before to after |
| Go | 3.39 to 1.85 | 1,485 to 821 | 33.69 to 18.64 |
| iOS | 4.93 to 2.57 | 472 to 307 | 14.86 to 9.91 |
| Android | 5.43 to 1.96 | 729 to 348 | 25.36 to 17.33 |
Over 21 weeks, CI resource use fell 53% and P95 wait fell 37%. Neither is a dollar figure.
Code review. uReview, Uber’s AI reviewer, grades and filters its own comments before a developer sees them. Developers rated 75% useful and acted on 65%+. Median turnaround: 4 minutes.
Governed access for agents. The GenAI Gateway is the single door to LLMs, tracking usage and sensitive data at 16 million queries a month. The MCP Gateway is the single door from AI agents to internal tools, via the Model Context Protocol, across 800+ servers. Every tool starts disabled until its owner switches it on.
Uber’s software factory report attributes 70%+ of pull requests to AI agents, with cost per 1,000 model requests down 34% from peak. Uber does not define “attributed,” so read it as agent-assisted work. On the Q1 2026 earnings call, Uber’s CEO put fully autonomous code at about 10%, human-reviewed before commit.
| Operating decision | What it produced |
| Shadow traffic and auto-rollback on the platform | Regressions caught in hours, before they reach users |
| Gateways own model and tool access | One place to track usage, cost, and sensitive data |
| Tools start disabled, owners enable them | Agents reach only what a service owner has approved |
| Cost per request tracked as usage grows | Agent adoption up 7x while spend per request fell |
Business Outcomes in Numbers
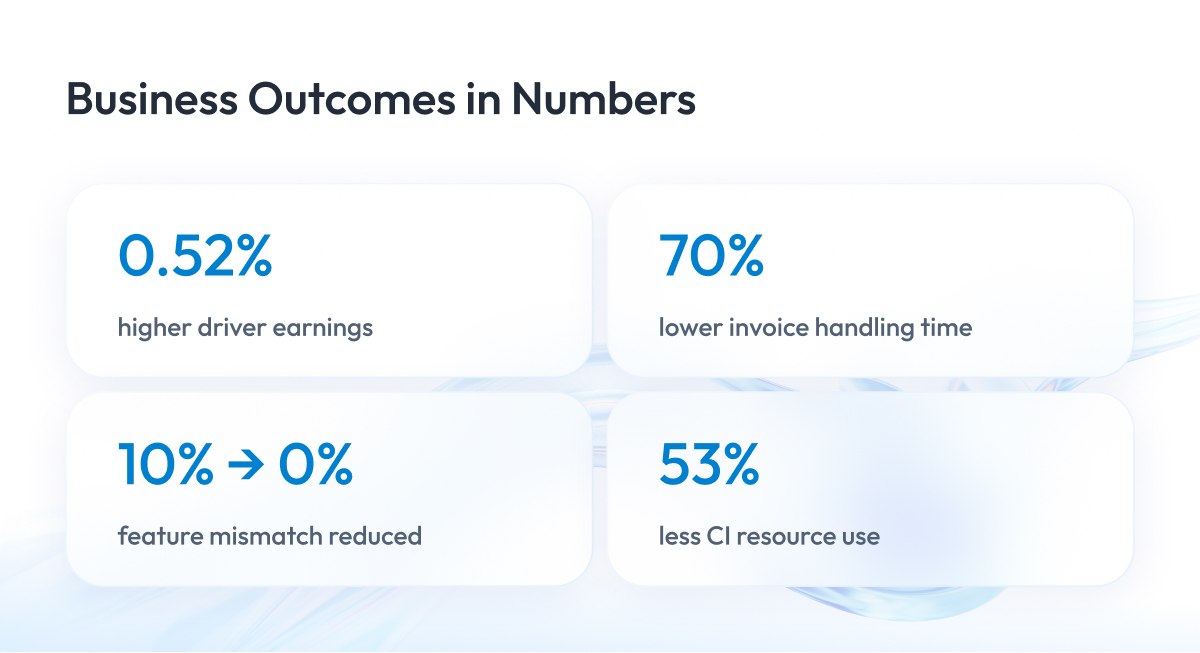
Uber reports results per system, with the scope stated. Each figure below stays attached to the workflow it measured.
| Area | Metric | Result |
| Marketplace | Driver earnings | Up 0.52% |
| Marketplace | Rider cancellations | Down 2.2% |
| Maps | Long-trip arrival accuracy | Up 6% |
| Uber Eats | Search latency | Cut in half |
| Finance | Invoice handling time | Down 70% |
| Finance | Invoice processing cost | 25 to 30% lower |
| Data | Feature mismatch, search and ranking | From over 10% to 0% |
| Data | Data freshness | From hours to minutes |
| Data | Metadata propagation | From over 1 hour to 15 minutes |
| Engineering | CI resource use | Down 53% |
| Engineering | CI P95 wait time | Down 37% |
| Engineering | uReview comments rated useful | 75% |
| Engineering | Cost per 1,000 model requests | Down 34% from peak |
A 0.52% change in driver earnings reads as small. Across almost 9 million people earning on the platform, it is not.
What is an estimate or a count, not a result
| Figure | Status |
| $100 million a year from DeepETT | Estimate, methodology not published |
| 13,000 engineering hours saved by Genie | Internal estimate |
| 70% of pull requests attributed to agents | Attribution method not defined |
| 800+ MCP servers, 5,000 tools | Inventory, not usage |
| Company-wide AI return | Not established by any published source |
Uber draws most of these distinctions itself. An enterprise reading the case should keep them.
Conclusion
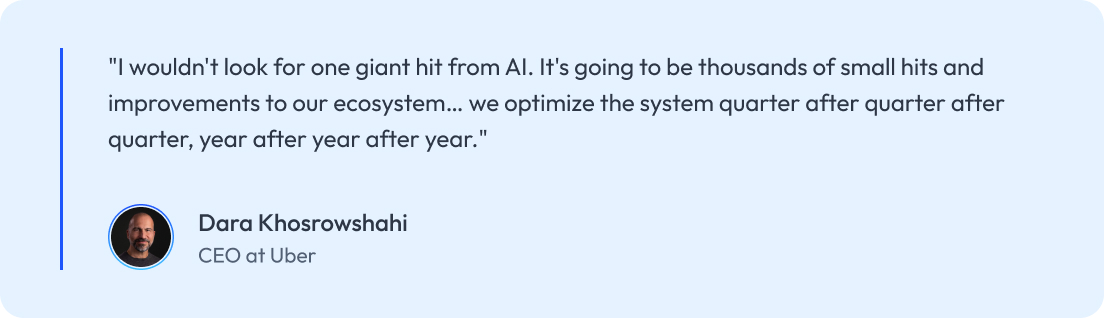
Uber’s AI story is usually reduced to one throughput number. The number is the output of a chain of choices. Uber chose to:
- Build one route to production before building many models
- Let product teams own models, and the platform team own the platform
- Make validation, rollback, and shadow traffic platform features
- Train on the features production actually saw
- Optimize the marketplace, not the immediate match
- Change the metric before changing the architecture
- Keep a reviewer inside every GenAI workflow, and drop GenAI where a plain tool did the job
- Point prediction at its own delivery pipeline
Each decision produced what the next one needed. That is why Uber’s results arrive with their denominators attached.
The transferable lesson is the order. A platform first, then data that can be trusted, then models inside a workflow with a human checkpoint, then the delivery pipeline itself.
The same sequence underpins legacy modernization programs that hold up over years.
Which layer is missing today? And will the next AI investment land on something that can carry it?