







Quick Summary
- Retail analytics turns POS, CRM, e-commerce, and sensor data into specific store decisions, so every metric worth keeping has a decision and an owner attached to it.
- The barrier is rarely the algorithm: sales, customers, orders, and stock sit in systems that do not agree on what a customer or a product even is.
- Seven metrics pass the test of actually changing a decision, among them sell-through rate as the earliest warning, GMROI for cash tied up in stock, and sales per square foot for layout.
- Computer vision fills the gap POS data cannot, measuring footfall, dwell time, queue length, and shelf gaps, and it already beats manual shelf audits reliably.
- Put the first AI budget into demand forecasting and shelf monitoring where payback is proven, and treat flashier claims with patience until they prove out in your own stores.
Retail analytics turns your everyday data (what sold, what sits in stock, how shoppers move through each store) into decisions you can act on this week, like what to reorder, what to mark down, where to move a display, and when to add staff.
The difficulty sits in the data. Most retailers already collect far more than they use, spread across POS, e-commerce, and loyalty systems that don’t agree on what a customer or a SKU even is.
We build retail data platforms for enterprise retailers, so we wrote this guide the way we approach the work, starting from the store decision the data should drive.
You’ll get the four types of analytics, a map from each data source to the decision it feeds, where AI and computer vision earn their place, the metrics worth tracking, and how to unify siloed data.
By the end, you’ll know where to start with the data you already have, which store decisions to target first, and whether to buy a retail analytics platform or build one yourself.
What Is Retail Analytics?
Retail analytics is the practice of collecting and analyzing data from POS systems, CRM systems, e-commerce platforms, and in-store sensors to inform retail decisions on inventory, pricing, assortment, and store operations. Put simply, it is the difference between “I think this product sells well” and “I know it sells, to whom, and when.”
Every store, online or physical, produces a stream of data all day without anyone lifting a finger. Four systems capture most of it:
- POS (the checkout) records what sold, when, and at what price.
- CRM and loyalty show who is buying, how often, and what they tend to come back for.
- E-commerce captures what shoppers browse, add to the cart, and abandon.
- In-store cameras and sensors track how many people walk in, where they linger, and which displays they pass without stopping.
On its own, each of these is just a pile of raw numbers. It tells you what happened somewhere, in one narrow slice, with no verdict attached. Retail analytics is the step that connects those slices and turns them into an answer to a single question: what should we do next?
Those answers stay practical:
- What to reorder, and how much, so shelves aren’t empty and the warehouse isn’t overstocked.
- What to discount, and when, before slow stock ties up cash.
- Where to move a product in the store so more people notice and buy it.
- How many staff to schedule, and at which hours, to match real foot traffic.
Think of it like driving. Two drivers head to the same place. One goes from memory and hopes the roads are clear. The other uses a navigation app that reads live traffic and reroutes on the fly.
Both have the same roads in front of them, but only one is making decisions with the full picture. Retail analytics is that navigation app for a retail business.
Everything later in this guide, from the four types of analytics to choosing a platform, builds on this idea. If you want the big-data side of this foundation, we cover it in our guide to big data analytics in retail.
The Four Types of Retail Analytics
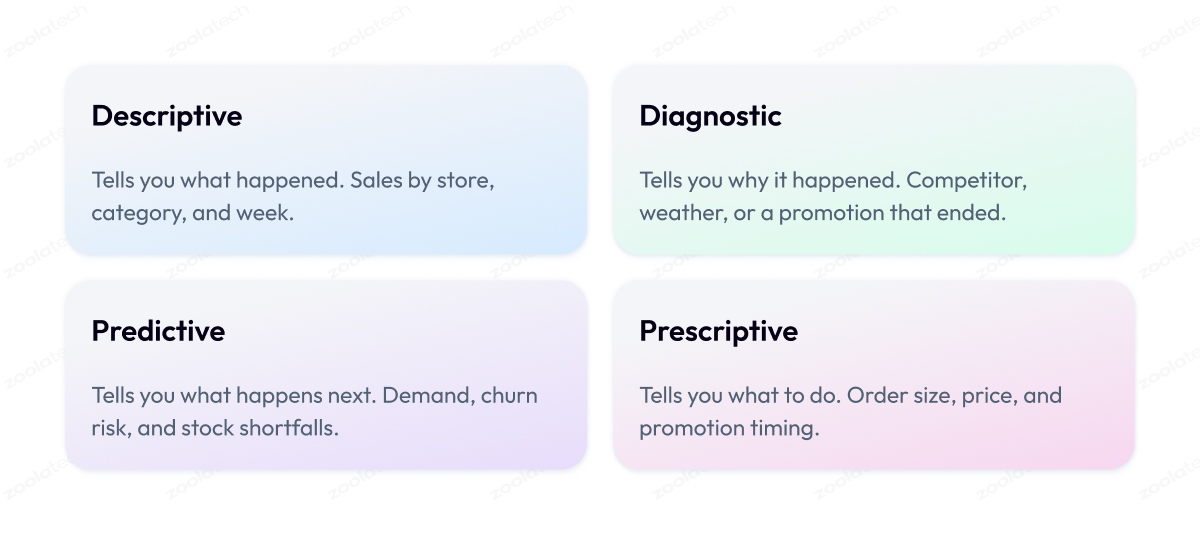
Retail analytics comes in four types, and each one answers a different question:
- Descriptive tells you what happened.
- Diagnostic tells you why it happened.
- Predictive tells you what will happen next.
- Prescriptive tells you what to do about it.
Let’s look at each one in more detail.
1. Descriptive analytics (what happened)
Descriptive analytics is the reporting layer, and it covers the numbers most retailers already track. It shows sales by store, category, and week, which products are moving, and which ones are sitting on the shelf.
Think of it as the scoreboard for the business. It won’t tell you why something happened or what to do about it, but it gives you an accurate record of performance, which is the starting point for every other type of analysis.
2. Diagnostic analytics (why it happened)
Diagnostic analytics explains the reasons behind the numbers. When sales in a region drop, it helps you understand the cause, whether that is a competitor opening nearby, a change in the weather, or a promotion that just ended.
It works by comparing data across time periods, locations, and customer groups to find the factor that moved the result. This is the type that keeps teams from fixing the wrong problem.
3. Predictive analytics (what will happen)
Predictive analytics uses your historical data to estimate what is likely to happen next. It can forecast demand for a product in the coming weeks, flag which customers are likely to stop shopping with you, or highlight stock that will probably run short before your next delivery.
The value of retail predictive analytics is timing, since it lets you prepare for what is coming instead of reacting once it has already affected sales.
4. Prescriptive analytics (what to do)
Prescriptive analytics goes one step further and recommends the action to take. Instead of only telling you that demand will dip in spring, it suggests something specific, such as reducing a purchase order by a set amount and moving a promotion earlier.
It weighs the likely outcomes of different options and points to the one most likely to hit your goal. This is the most demanding type to build, because its advice is only as trustworthy as the data and models behind it.
| Type | Question It Answers | Retail Example | Decision It Drives |
| Descriptive | What happened? | Q3 sales down 6% in region | Flag weak stores for review |
| Diagnostic | Why did it happen? | Competitor opened nearby | Adjust local pricing or promotion |
| Predictive | What will happen? | Demand dips next spring | Lower forward purchase orders |
| Prescriptive | What should we do? | Cut order 15%, shift promo | Auto-adjust replenishment and markdown |
Knowing the types of retail analytics is the easy part. The harder question is which type to apply to which decision, and that is exactly what the next section maps out.
From Data to Decisions: The Retail Analytics Decision Map
By now you know the four types of analytics. The obvious next question is what to actually do with them, because most retailers already have more reports and dashboards than they use. This section shows you how to connect each piece of data you collect to a specific decision it should help you make.
The map below lays this out. On one side is the data you have. On the other is the decision it should drive.
- Demand forecasts tell you how big your next purchase order should be. If a product is predicted to slow down, you order less and free up cash.
- Footfall and heat-map data tell you where to place products. If shoppers keep walking past a display, that product belongs somewhere busier.
- Sell-through rate tells you when to run a markdown. If stock is moving too slowly to clear in time, you drop the price before the season ends.
- Loyalty and purchase history tell you which promotion to send whom. What someone bought before is your best guide to what will bring them back.
- Out-of-stock data tells you when to reorder. An empty shelf loses money every hour, so that alert needs to reach the right person fast.
A specific piece of data points to a specific decision, with someone responsible for acting on it. When you build your analytics around these connections instead of around the data you happen to have, the reporting stops being decoration and starts running the business.
This is exactly the problem we solve in enterprise retail data work, where teams often have plenty of dashboards but no path from a number to a decision. Our retail data analytics services page covers how that foundation gets built.
Retail Analytics Use Cases: From Signal to Store Decision
The Decision Map showed the pattern in general. This section makes it concrete. For each of the five areas where retail analytics pays off first, here is how it plays out in an actual store, so the use case becomes easier to picture.
Inventory and replenishment
Retail inventory analytics keeps shelves stocked without tying up cash by matching each reorder to how fast that product sells in that location.
Picture a grocery chain with two stores a few miles apart. One runs out of a popular yogurt by Friday. The other throws the same product away unsold. Both order from one fixed template, so both are guessing.
Inventory analytics looks at each store on its own:
- It tracks the product’s sales pace by location.
- It weighs current stock against supplier lead times.
- It sets a reorder quantity that is appropriate for each store.
The busy store gets more, the slow one gets less, and the chain stops losing sales to empty shelves while cutting waste. When stores and online channels share a single stock view, your omnichannel retail analytics becomes far more accurate, which is the focus of our guide to ecommerce inventory management.
Assortment and merchandising
Retail merchandising analytics determines which products each location should carry based on that location’s sales.
An apparel retailer stocks the same jacket in every store. It sells out in colder northern cities and sits untouched in the south, where it gets marked down at a loss.
Merchandising analytics catches that split early:
- It compares sales of each item across stores and regions.
- It flags where a product wins and where it drags.
The buyer can then ship more to the stores that move it and pull it from the ones that don’t, so shelf space goes to products that sell locally. Our overview of online merchandising covers the digital side of the same idea.
Pricing and markdown
Retail pricing analytics sets the shelf price and the timing of markdowns by tracking demand and how quickly stock is clearing.
Take a seasonal item like patio furniture. A discount that lands at the wrong moment either gives away margin on stock that would have sold at full price, or leaves you clearing leftovers at rock-bottom prices once the season ends.
Pricing analytics takes the guesswork out of that call:
- It watches sell-through against the time left in the season.
- It weighs current demand and competitor prices.
- It flags the moment a markdown clears the stock while holding the most margin.
You hold the price while it makes sense, then move at the point the data points to. Because this depends on how promotions are run, it is closely tied to promotion and discount management.
Customer and personalization
Retail customer analytics identifies who your shoppers are and what brings them back, using purchase history and loyalty data across channels.
Think of a loyalty member who buys coffee every week but has never walked down the bakery aisle. A blanket “10% off storewide” email does nothing for them.
Customer analytics makes each offer fit the person:
- It groups shoppers by what they buy.
- It matches each group to an offer that suits it, like a pastry deal for the coffee regular.
Offers get more relevant, response rates climb, and you stop handing discounts to people who would have bought anyway. This same customer data drives ecommerce personalization online.
Store layout and staffing
Behavior analytics in retail shows how shoppers move through a store and when they arrive, using footfall counts, dwell time, and hourly traffic.
In one common case, a store’s highest-margin products sit in a back corner that heat-map data shows almost nobody reaches. The same data shows the store fills up at lunch but keeps the same staffing all day.
Behavior analytics points to two low-cost fixes:
- Move high-margin products into the main traffic path where more people see them.
- Shift staff toward the midday rush so lines stay short when it counts.
Both changes turn store data you already collect into more sales per visit.
The idea behind all five is the same. You are already making these calls every day. Analytics just means making them from what the data shows, instead of from a hunch.
AI and Computer Vision in Retail Analytics
Up to now, everything ran on data your systems already collect. AI and computer vision are where most retailers ask the same two questions: does the AI everyone talks about actually change anything, and can the cameras already hanging in my stores give me something useful?
This section answers both and shows where the money is well spent today versus where the hype still lags reality.
Predictive and prescriptive AI
Predictive analytics in retail uses machine learning to forecast demand, spot customers likely to leave, and flag stock that will run short before the next delivery.
The everyday version of this is the reorder suggestion or the demand forecast we covered earlier. AI makes those forecasts sharper because it learns from far more signals at once, such as past sales, weather, promotions, local events, and online browsing, and keeps adjusting as new data arrives.
A modern AI retail analytics platform takes this a step further into prescriptive territory. Rather than stopping at “demand will rise 12% next month,” it recommends the specific order size, price, or staffing level that fits that forecast. The manager still approves the call, but the starting point is a concrete suggestion backed by data.
Computer vision on the store floor
Computer vision retail analytics turns ordinary in-store camera feeds into measurable data, tracking footfall, dwell time, queue length, and shelf gaps that sales data alone cannot show.
POS data tells you what people bought. It stays silent on what they picked up and put back, how long the checkout line got, or which display they walked straight past. Video analytics in retail fills that gap and answers questions managers used to settle from memory:
- Footfall and heat maps show how many people enter and where they spend time.
- Shelf and planogram monitoring flags empty shelves and products out of place.
- Queue detection signals when to open another register before shoppers walk out.
- Loss prevention spots patterns at the self-checkout that indicate shrinkage.
This floor-level data directly informs the layout and staffing decisions in the use cases above. On the in-store sensing side, our work on in-store and beacon analytics goes into greater depth.
What actually works, and where privacy fits
The honest answer is that demand forecasting and shelf monitoring deliver value today, while some flashier “AI” claims stay closer to demo than deployment.
A few things hold up well in production:
- Demand forecasting, which has years of proven use in replenishment and pricing.
- Shelf-gap and planogram alerts, where cameras reliably beat manual audits.
- Footfall and queue analytics that directly inform staffing and layout changes.
So the practical takeaway is simple. Put your first AI budget into demand forecasting and shelf monitoring, where the payback is proven, and treat the flashier claims with healthy patience until they prove themselves in your own stores.
Metrics That Matter (and the Decision Each Drives)
That AI advice is only as good as the numbers you feed it, so it helps to know which metrics are worth tracking. Most retail dashboards show dozens of them, and the majority just sit there looking busy.
This section cuts the list down to the handful that change a decision, and pairs each one with the decision it drives.
The test for any metric is simple. If a number moves and nobody does anything differently, it belongs in a report you can ignore. The ones below pass that test.
| Metric | What It Tells You | Decision It Drives |
| Sell-through rate | How fast stock is clearing | When to reorder or mark down |
| GMROI | Profit earned per dollar of inventory | Which products to keep or cut |
| Sales per square foot | Revenue each area of the store earns | Layout and space allocation |
| Conversion rate | Share of visitors who buy | Staffing, layout, and promotions |
| Footfall | How many people come in | Staff scheduling and open hours |
| Average transaction value | How much each shopper spends | Bundling and upsell placement |
| Out-of-stock rate | How often shelves sit empty | Replenishment and supplier review |
A few of these deserve a plain-language note, since the names hide what they do:
- Sell-through rate is the earliest warning sign in retail. A low rate means stock is moving too slowly, which tells you a markdown is coming before it becomes urgent.
- GMROI answers a question gross margin alone cannot, which is whether a product earns enough to justify the cash tied up in stocking it. A high-margin item that barely sells can score worse than a low-margin one that flies off the shelf.
- Sales per square foot turns your floor space into a scoreboard, showing which areas pull their weight and which are candidates for a different product or display.
You do not need all seven from day one. Pick the two or three tied to the decisions you most want to improve, get them reporting reliably, and add the rest as your data foundation matures.
How to Build a Retail Analytics Capability and Beat Data Silos
Everything in this guide, from the four types to the metrics above, assumes one thing is in place. Your data has to be joined up. This section is about getting it there, because it is the step that decides whether any of the analytics we have covered will work at all.
The approach below reflects how we build these platforms for enterprise retailers, where the work almost always starts with the same problem.
The barrier to retail analytics is rarely the algorithm or the tool. It is that your data lives in separate systems that do not talk to each other. Sales sit in the POS, customers in the CRM, orders in e-commerce, and stock in a warehouse system, and none of them agree on what a customer or a product even is.
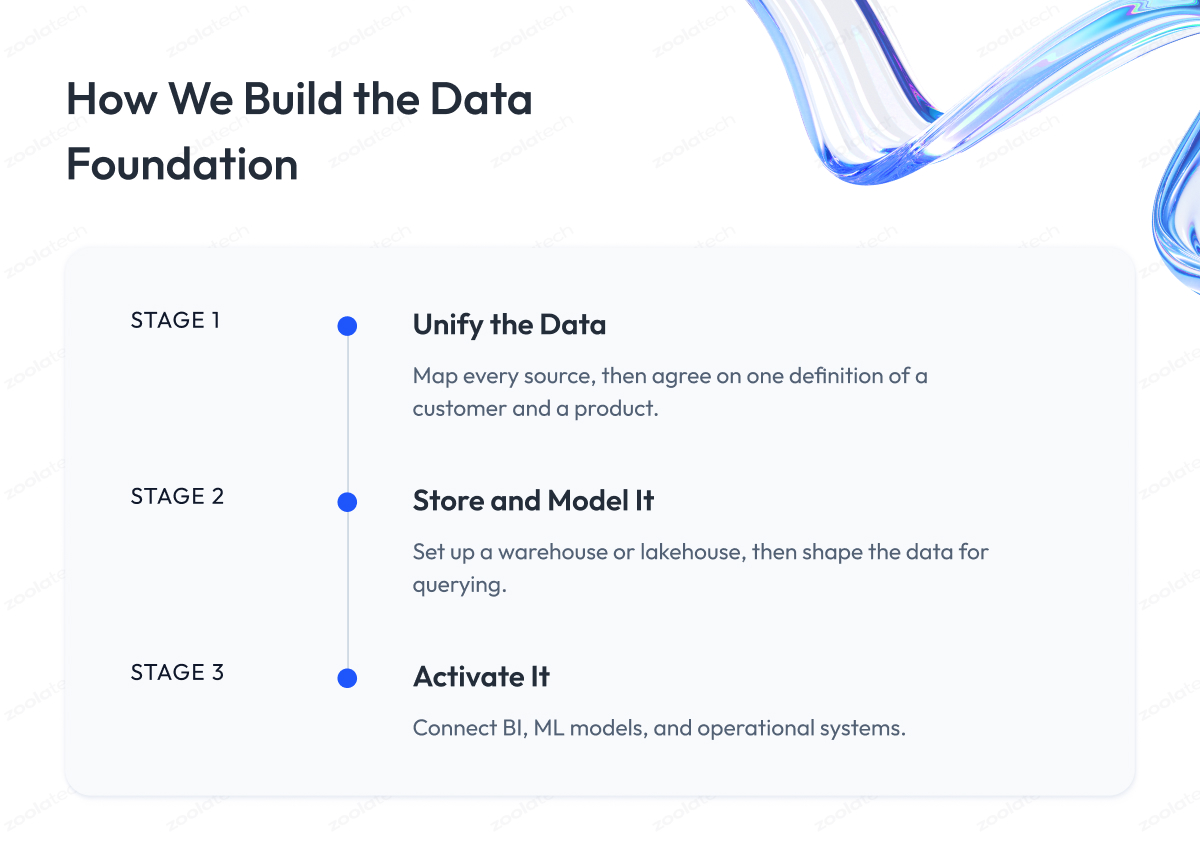
Until you fix that, every dashboard is built on shaky ground. So we approach the work in three stages.
Stage 1 – We unify the data
We start by bringing all data sources together under a shared definition of the basics. Before writing a single model, we map out where your data lives, then agree with your team that a customer is the same customer online and in store, and that a product keeps the same ID everywhere it appears.
This is the unglamorous part most projects underestimate, and it is the part that makes everything after it possible. We build the pipelines that pull sales, inventory, and loyalty data into one place and reconcile the mismatches between systems, so a question like “what did this customer buy across every channel last year” finally has a trustworthy answer. Our guide to big data analytics in retail covers the heavy-data side of this in more detail.
Stage 2 – We store and model it in a warehouse or lakehouse
Once the data is flowing, we give it a home and a structure that makes it usable. We set up a data warehouse or a lakehouse, a central store built for analysis instead of running daily transactions, and choose between them based on the data you actually have.
That choice matters in practice. We use a warehouse when your data is well organized and headed mostly for reporting. We use a lakehouse when you also need to handle messier inputs like images and sensor feeds, which is common for retailers leaning into computer vision. From there, we model the data into tables and relationships that your business users and reports can query directly, without needing an engineer in the loop each time.
Stage 3 – We activate it through BI, ML, and the front line
Stored data still does nothing on its own, so the final stage is where we put it to work in the places decisions get made. We connect the data to the tools and systems your teams already use.
That activation takes a few forms:
- BI dashboards to give merchandisers and managers the reports and metrics they check day to day.
- Machine learning models to run the demand forecasts and recommendations we covered in the AI section.
- Operational systems to get insights to the floor, such as a reorder alert landing with the person who places the order.
Our aim here is to close the loop, so data turns into a decision, and that decision reaches whoever acts on it.
Built in this order, a retail data analytics capability stops being a pile of disconnected tools and becomes a pipeline that runs from raw data to a decision someone makes in a store. This is the core of what we do for enterprise retailers, and our retail data analytics services page walks through how we deliver.
The Retail Analytics Maturity Model
You now know how the pieces fit together. The next question is a practical one about you. Where does your retail business sit today, and what is the next step worth taking? This maturity model lays out the stages retailers go through, so you can identify your level and see what comes next.
You run on spreadsheets and gut feel
At this stage, you run on exported reports and experience. Your team pulls sales into spreadsheets, and your best decisions come from managers who know their stores well.
This gets you surprisingly far, but it breaks as you grow. The data ages the moment you export it, and nobody can agree on which version is right. If this sounds like you, your next move is a single source your whole team trusts.
You have live dashboards
Here you have live dashboards, so you can see sales, stock, and traffic without waiting for someone to build a report. You have reached descriptive analytics, and you know what is happening across your stores in close to real time.
This is where many retailers settle, and it is a solid place to be. The limit is that your dashboards tell you what happened, and you still have to work out why and what to do. Your next step is to add the “why” and start looking forward.
You can predict what happens next
At this stage, your data starts working ahead of you. You forecast demand, flag customers likely to leave, and spot stock issues before they hit the shelf. You have moved from reacting to last week toward preparing for next week.
Reaching this rung means your data foundation is solid and your models can be trusted. For you, the payoff shows up as fewer stockouts, sharper orders, and pricing that keeps pace with demand.
Your systems act on their own
At the top, your systems recommend the action and, for lower-risk decisions, take it for you. Routine reorders and markdowns run automatically within rules you set, while your people focus on the calls that need judgment.
Few retailers run their whole operation here, and you do not need to. The goal is to automate the decisions that are safe to hand over, so your team spends its time where it matters most.
Wherever you land, the honest takeaway is that most retailers sit at the dashboard stage, and that is fine. You get more from doing the next stage well than from reaching for the top before your data is ready.
Retail Analytics Tools and Platforms: Build vs Buy
Once you know where you sit on that ladder, the next decision is what to run your analytics on. This is where most budgets get spent, and where the build-versus-buy question comes up. This section gives you a straight answer on when to buy an off-the-shelf platform and when to build your own, plus a look at the main categories of tools on the market.
When to buy a retail analytics platform
A retail analytics platform gives you dashboards, connectors, and reports out of the box, so you can be up and running in weeks instead of months. For most retailers, this is the sensible starting point, especially when your needs look like everyone else’s.
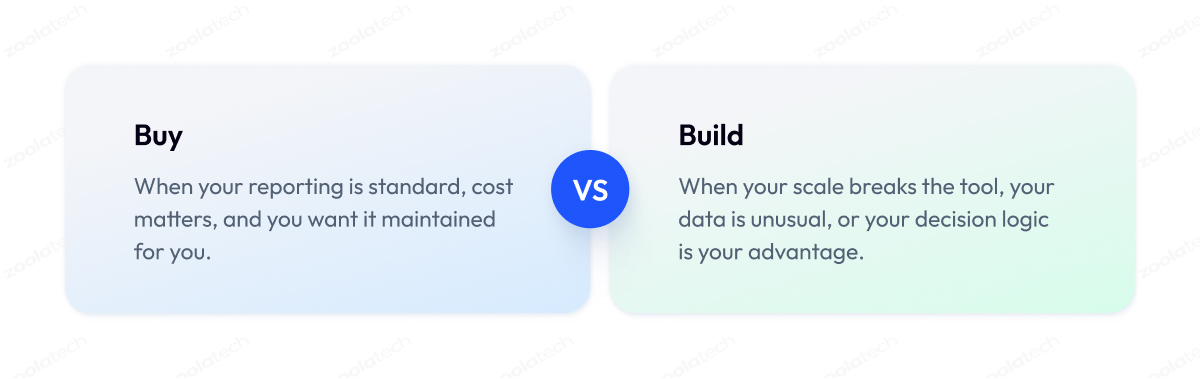
You should lean toward buying when:
- Your reporting is standard. A packaged retail analytics software product already handles sales, inventory, and customer reporting.
- Cost is a factor. Paying for a proven tool is cheaper than building the same thing yourself.
- You want it maintained for you. Updates, support, and improvements arrive without your engineers lifting a finger.
If that describes your situation, buying gets you results faster and cheaper than starting from scratch, and it frees your team to focus elsewhere.
When to build your own
You build when an off-the-shelf tool starts holding you back. That usually happens for one of a few reasons, and you will feel it before you can name it.
Building makes sense for you when:
- Your scale breaks the tool. Hundreds of stores and billions of rows push many packaged products past their limits.
- Your data is unusual. Heavy use of computer vision, sensors, or a custom loyalty model rarely fits a standard schema.
- Your decision logic is the advantage. A pricing or forecasting method your competitors lack is worth owning, so no vendor can sell it to them too.
Building costs more upfront and needs engineering talent, but it gives you a system shaped around your business instead of the average of everyone else’s.
The main categories of tools
Most retail analytics tools fall into a few groups. Knowing which is which helps you shortlist without getting lost in vendor pitches.
| Category | What It Does | Fits You If |
| General BI platforms | Dashboards and reports on any data | You want flexible, company-wide reporting |
| Retail-specific analytics | Prebuilt retail metrics and workflows | You want fast setup with less custom work |
| Computer vision platforms | Footfall, shelf, and queue analytics | You need in-store, floor-level data |
| Custom-built platform | A system shaped to your data and logic | Your scale or edge outgrows packaged tools |
Names you will meet in the general BI category include Tableau, Power BI, Looker, and ThoughtSpot, and each connects to retail data without being built only for retail.
The retail-specific and computer vision categories hold more focused products, and many are sold as packaged retail analytics solutions, while the custom route is where our work usually sits.
Plenty of retail analytics companies will sell you a platform, but most retailers land on a mix.
You might buy a BI platform for everyday reporting and build custom models for the forecasting or pricing logic that sets you apart. If you are weighing that balance for your own stack, our retail data analytics consulting team helps you decide what to buy, what to build, and how to make the two work together.
Final Word
Retail analytics comes down to taking the data you already collect and using it to back up a decision you were going to make anyway.
Getting there takes serious work. You have to unify data trapped in separate systems, pick the metrics worth watching, and choose which tools to buy and which to build. None of that happens in a week, and the temptation is either to boil the ocean or to put it off entirely.
So pick your first decision, find where you sit on the maturity ladder, and take the one step above it. The cost of staying on spreadsheets is not dramatic on any single day, but over a year it shows up as lost margin, missed demand, and stock in the wrong stores.
When you are ready to move faster, we are here to help. We build retail data platforms for a living, and we are glad to review your data, goals, and current setup and map out a practical path.
Questions You May Have
What is retail analytics?
Retail analytics is the practice of collecting and analyzing data from POS, CRM, e-commerce, and in-store sensors to guide decisions on inventory, pricing, assortment, and store operations, turning raw numbers into specific actions a store can take.
What are the four types of retail analytics?
The four types are descriptive (what happened), diagnostic (why it happened), predictive (what will happen next), and prescriptive (what to do about it), each supporting a different kind of decision.
What is retail analytics used for?
Retail analytics is used to decide what to reorder, when to mark down stock, which products to carry in each store, which offers to send to which customers, and how to place products and staff to match foot traffic.
What is computer vision retail analytics?
Computer vision retail analytics turns in-store camera feeds into measurable data such as footfall, dwell time, queue length, and shelf gaps, giving you floor-level signals that POS and sales data alone cannot capture.
What metrics matter most in retail analytics?
The metrics worth tracking are the ones that change a decision, mainly sell-through rate, GMROI, sales per square foot, conversion rate, footfall, and out-of-stock rate, each tied to a specific action.
How do you start with retail analytics?
Start by picking one decision you want to improve, unify the data behind it into a single trusted source, prove its value, then expand to the next decision instead of building everything at once.
What is the best retail analytics software?
There is no single best retail analytics software, since the right choice depends on your scale and needs, but common options include general BI tools like Tableau, Power BI, and Looker alongside retail-specific and computer vision platforms.
What is the difference between retail analytics and business intelligence?
Business intelligence is the broader practice of reporting on company data, while retail analytics applies those methods to retail-specific decisions like assortment, markdown timing, replenishment, and store layout.
Is retail analytics worth it for a small retailer?
Yes, a small retailer can start with an affordable off-the-shelf platform to get sales, inventory, and customer reporting, then move toward forecasting once the basics are reliable and the data is trustworthy.
How is AI used in retail analytics?
AI is used in retail analytics to forecast demand, predict which customers are likely to leave, recommend order sizes and prices, and read store video through computer vision for footfall, queues, and shelf gaps.
What are the current trends in retail analytics?
The main trends shaping the future of retail analytics are AI-driven demand forecasting, computer vision for in-store data, prescriptive analytics that recommend actions, and edge AI that processes camera feeds locally for speed and privacy.
What is POS data in retail analytics?
POS data is the record of every checkout transaction, showing what sold, when, and at what price, and it forms the backbone of most retail analytics before other sources like loyalty and sensor data are layered on.