









Data Observability Services

Data Monitoring and Alerting, Built on Your Stack
Zoolatech delivers data observability services as an engineering partner, not a software vendor. We design and implement monitoring, lineage, and alerting on tools you choose, and you own the stack.
Alerts your team trusts
Lineage you can act on
Your repos, your runbooks
Data Observability Services 1920
Data Observability Services 1440

Industry Leaders We Work With

“Gartner found 63% of organizations lack or doubt their data management practices for AI.” — Gartner

AI-ready data starts with proof that every dataset is fresh, complete, and traceable. Zoolatech builds that proof into your pipelines before models depend on them.
Scope of the Discipline

What Data Observability Actually Covers

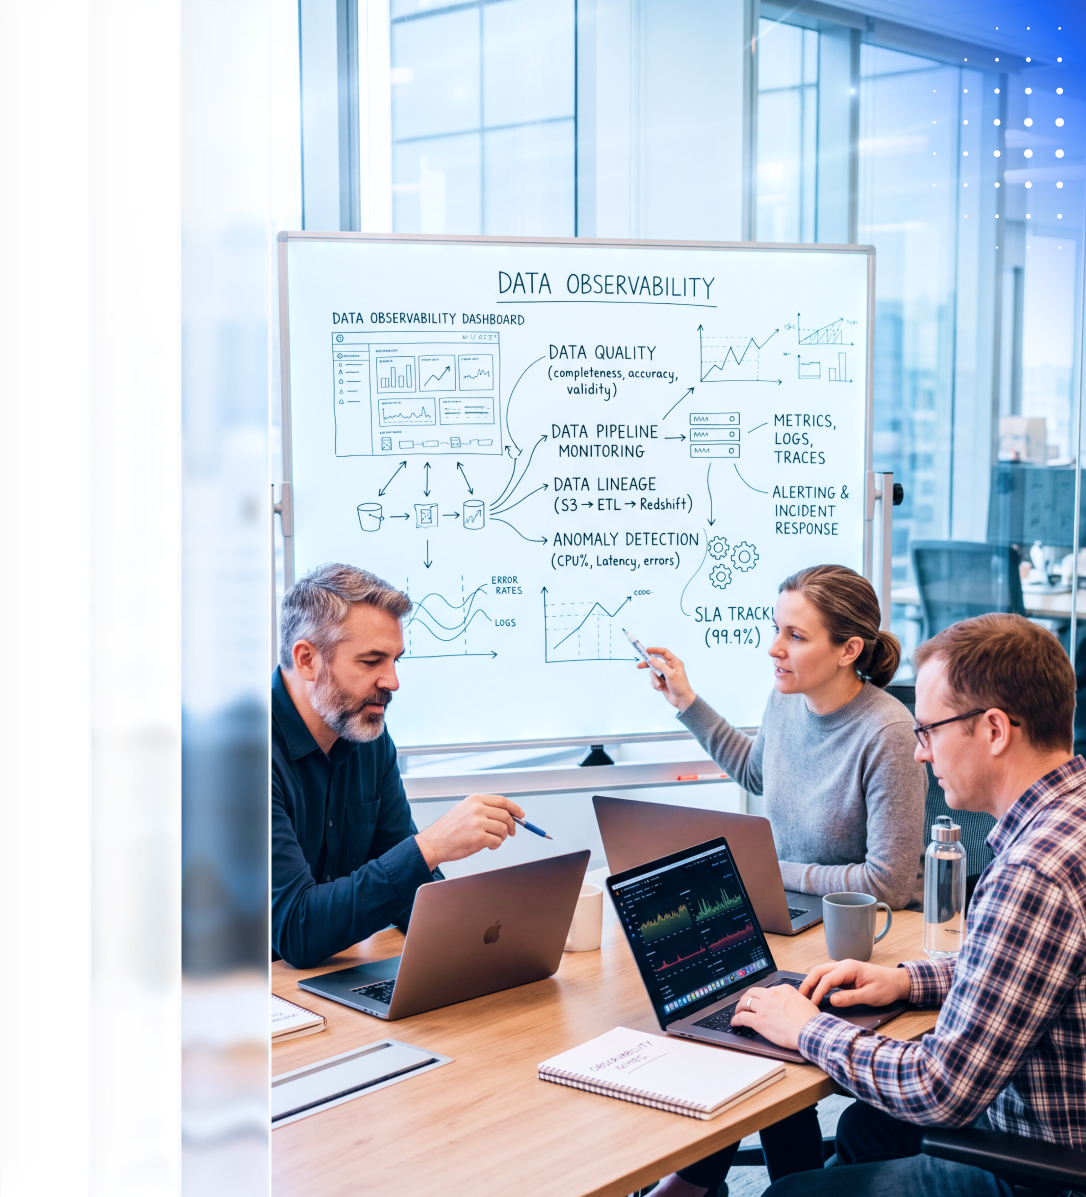
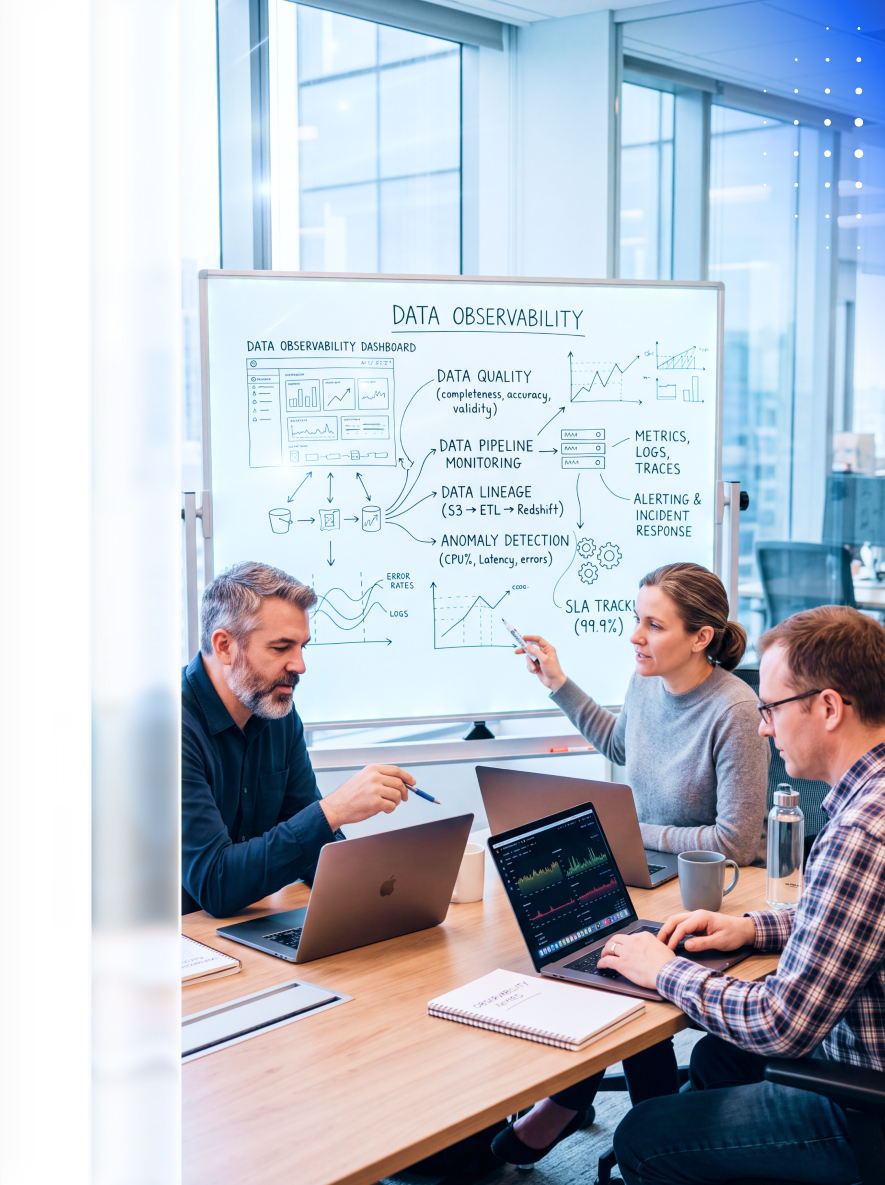
Data observability monitors the data itself, including freshness, volume, schema, distribution, and lineage, so teams detect broken data in a data pipeline before it reaches a decision.
What it watches

What it watches

Tables, datasets, files, and event streams, together with the jobs that produce and transform them, wherever they run.
What it answers

What it answers

Whether data freshness slips, rows go missing, a schema change breaks joins, or values drift, and which downstream reports are affected.
What it adds

What it adds

Root cause and impact, not only detection: data lineage shows where a break started and who inherits it.
What it skips

What it skips

Hosts, Kubernetes clusters, uptime, and request latency, which Prometheus, Grafana, OpenTelemetry, and APM tools already cover.
Where that belongs

Where that belongs

Teams usually need both disciplines, with different owners. Server and service health sits under infrastructure observability.
What Breaks First

Silent Failures, Caught Early

Spot the patterns behind wrong dashboards, stale forecasts, and reports nobody trusts.
Data freshness

Data freshness

A table stops updating overnight, and Monday’s revenue dashboard presents Friday’s numbers as current, with no error raised.
Data volume

Data volume

Row counts drop by half after a partner changes an export, and forecasts train on a partial dataset.
Schema drift

Schema drift

An upstream team renames a column, and every downstream join returns nulls without failing a single job.
Value distribution

Value distribution

Values stay in range but shift, like prices suddenly reported in cents, and margin reports look wrong.
Data lineage

Data lineage

Nobody knows which reports read a broken dataset, so a quick fix turns into a day of guessing.
Data pipeline monitoring

Data pipeline monitoring

Each data pipeline run is checked against all data signals, so data downtime is caught at the load, not in the meeting.
Our Edge

Why Enterprise Data Teams Choose Zoolatech

You get detection your engineers trust and a practice that stays yours after we leave.
Engineers, not licenses

Engineers, not licenses

We earn nothing from monitoring licenses, so every tool recommendation follows your stack, budget, and team skills.
Root cause included

Root cause included

Every alert connects to data lineage, so your team receives the origin of a break along with the symptom, which shortens the path to a fix.
Business-impact priorities

Business-impact priorities

Coverage starts with the pipelines that touch revenue and compliance, not with whatever is easiest to instrument.
Zero vanishing jobs

Zero vanishing jobs

A US construction-tech platform reached zero vanishing jobs, with every job traceable end to end.
Proven at scale

Proven at scale

We built Zalando’s real-time customer data pipeline with data SLOs, anomaly detection, and monitoring: ~2.5B records processed per day and more than 50% reduction in processing costs.
Senior engineering depth

Senior engineering depth

Data observability work draws on Zoolatech’s 600+ specialists across Poland, Ukraine, Mexico, and Turkey.
Working in your hours

Working in your hours

Engineers work within your time zones and join your standups and incident calls instead of handing off overnight.
Delivery governance built in

Delivery governance built in

Every engagement includes a dedicated delivery manager, a live risk register, and a formal QA checkpoint before release.
Service Scope

Our Data Observability Services

Data observability consulting and delivery, from first audit to operations.
Assessment

Find the blind spots first

  • Inventory of critical data pipelines, datasets, and their owners
  • Coverage gaps scored on every data signal
  • Past incidents grouped by root cause and cost
  • A ranked backlog of checks by business impact
  • Inputs from a data readiness assessment where AI is planned
  • Review of existing data quality tests worth keeping
Monitoring design

Checks shaped to your data

  • Data freshness windows set per dataset and consumer
  • Volume baselines that respect weekly and seasonal cycles
  • Schema change detection on every critical source table
  • Anomaly detection trained on your historical distributions
  • Data SLOs agreed with the teams that consume each dataset
  • Separate criteria for AI-ready vs. high-quality data
  • Anomaly detection on business metrics, not only row counts
Alerting and escalation

Signal over noise

  • Alerts written as code and reviewed in pull requests
  • A named owner and escalation path for every alert
  • Severity-based routing to your on-call and chat tools
  • Deduplication so one incident raises one alert
  • Scheduled reviews that retire alerts nobody acts on
  • Escalation paths tested before each go-live
Lineage and impact analysis

See what a break touches

  • Column-level data lineage from source system to dashboard
  • OpenLineage events from Airflow and Spark jobs
  • Impact reports generated before a schema change ships
  • Lineage evidence that supports data governance for AI
  • Upstream producers notified when their change breaks consumers
  • Schema drift traced to the job that introduced it
Incident response

From page to root cause

  • Triage runbooks for each critical data pipeline
  • Root cause traced through lineage, not guesswork
  • Stakeholder updates naming affected reports and datasets
  • Backfill plans for datasets that loaded bad records
  • Post-incident reviews that add the missing check
  • Data downtime logged per incident for trend reporting
Managed operations

Coverage after go-live

  • Ongoing triage and threshold tuning on your stack
  • New datasets brought under monitoring as they launch
  • Regular reporting on data downtime, MTTA, and MTTR
  • Coverage reports listing every unmonitored data pipeline
  • Onboarding of new sources into existing data SLOs
Entry Scenarios

Where Teams Start

Your situation decides the first deliverable. Match it to one of four starting points.
New platform build
Existing pipelines
Post-incident
Pre-AI readiness

Monitor from launch

Checks written with the platform spare you a retrofit after the first production incident.
  • Signs: You are standing up Snowflake, Databricks, BigQuery, or Redshift, and dataset owners are not named yet.
  • First move: Design data SLOs and lineage capture into the AI-ready data architecture from day one.
  • You get: Monitoring, alerts, and runbooks that go live with the platform, not after it.
Image slot

Close live gaps

Pipelines already feed decisions, so coverage arrives without pausing a single load.
  • Signs: Analysts recount rows by hand before every executive report goes out.
  • First move: Rank pipelines by impact, then instrument the ones where rebuilding a data pipeline is off the table.
  • You get: Data freshness, volume, and schema drift checks on the pipelines that hurt most when they fail.
Image slot

Stop the repeat

A recent failure is the clearest map of where detection is missing and who noticed first.
  • Signs: A stakeholder found the bad number first, and finding the root cause took days.
  • First move: Replay the incident through data lineage and add the check that would have caught it.
  • You get: A written root cause, a new alert, and a runbook for next time.
Image slot

Trust training data

Models inherit every silent data error, so detection belongs in place before training starts.
  • Signs: Feature tables draw from many sources, and nobody can say how fresh each one is.
  • First move: Add data freshness and distribution checks to the AI data pipelines that feed training sets.
  • You get: Data lineage from every model input back to its source dataset, a core part of AI-ready data.
Image slot
Delivery Workflow

Our Data Observability Implementation Process

Our data observability implementation services run in six named steps, and each one ends with an artifact your team can open, review, and keep, whatever engagement model you choose.
Step 1

Discovery and inventory

We map critical data pipelines, datasets, consumers, and recent incidents with your data owners, and log the data downtime each incident caused, so priorities rest on evidence rather than opinion. Artifact: a ranked pipeline inventory with named owners.
Step 2

Signal and SLO design

We define checks for freshness, volume, schema, distribution, and lineage on each priority dataset, then agree data SLOs and data quality targets with the teams that depend on it, starting with the consumers who notice breaks first. Artifact: a signed-off monitoring specification.
Step 3

Tooling setup

We configure the chosen platform or open stack in your cloud accounts and repositories, and wire lineage capture into Airflow and Spark jobs so every dataset reports where it came from. Artifact: configuration and checks committed as code.
Step 4

Baseline and tuning

Thresholds and anomaly detection start from your historical data and run in shadow mode until false positives are understood and removed, so your on-call rotation never meets an untested alert. Artifact: a tuned alert set with expected alert volumes.
Step 5

Routing and runbooks

Every alert gets a severity, a destination in your on-call or chat tool, and a runbook written for an engineer who has never seen the dataset. Artifact: an escalation matrix and triage runbooks.
Step 6

Handover or managed run

Your engineers handle the first incidents with us alongside and then take over, or we keep running the stack under managed operations with the same documentation you would receive. Artifact: a handover pack and a known-limitations list.
Send your critical pipeline list. We map it onto these six steps.
Contact Sales
Delivery Options

How We Work: Engagement Models for Data Observability Consulting

Choose fixed price or time and materials, add ongoing support if you need it, and keep code ownership either way.
01

Consulting

Architecture review, tool selection, and a monitoring roadmap your team can implement on its own schedule.
02

Team extension

Data engineers join your sprints under your leads on time and materials, or as a long-term unit in your time zone.
03

Fixed-scope implementation

A fixed price, defined scope, and written acceptance criteria for a monitoring rollout on named pipelines.
04

Managed operations

After go-live, we run triage, tuning, and incident response as a managed service, while ownership stays with you.

“Only 26% of CDOs are confident their data can support new AI-enabled revenue streams.” — IBM Institute for Business Value

Confidence comes from data your team can see, test, and fix itself. Every check and runbook we build stays yours.
Handover Package

What You Own When We Are Done

Agency work often leaves knowledge in someone else’s head. Every item below lands with you.
check icon

Repositories

All checks, pipeline hooks, and configuration live in repositories inside your organization from the first commit. Nothing important sits in a Zoolatech account that you would have to request back when the engagement ends.
check icon

Runbooks

Each critical alert links to a runbook listing likely causes, the first queries to run, and who to notify, so on-call engineers act at any hour without calling us.
check icon

Alerts as code

Alert definitions, thresholds, and routing rules are versioned and reviewed like application code, so your team sees why a threshold changed, who approved it, and how to roll it back.
check icon

Documentation

Architecture diagrams and decision records explain where checks run, how data lineage is captured, and why each tool won over the alternatives we evaluated together, so new hires learn the setup without a walkthrough.
check icon

Access inventory

Every service account, API key, and permission created during the engagement is listed with an owner, so removing our access at the end of the engagement is a checklist, not a search.
check icon

Handover procedure

A written transfer plan fixes the date, the shadowing sessions, and the acceptance checks your team signs before responsibility for monitoring moves fully to your side.
check icon

Team training

Hands-on sessions on your own data pipelines cover tuning thresholds, onboarding new datasets, reading lineage during an incident, and adding a check afterward, so the practice grows without us.
check icon

Known limitations

We list what the setup does not cover yet, such as unmonitored sources or checks deferred for cost, so partial coverage is never mistaken for full protection, and each gap carries a suggested next step.
Market Consolidation

Built to Survive Vendor Churn

When your monitoring vendor is bought or shut down, your checks should survive the move.

Checks you keep

Monitoring vendors get acquired regularly. Checks stored in your repositories outlive any change of owner.

Portable lineage

Platforms absorb smaller tools and reshape them. OpenLineage keeps your lineage readable by any platform you move to.

Tests as code

Hosted products get retired. Tests written as code move to another tool with remapping, not rewriting.
Testimonials

What Our Customers Say

“In the case of Zoolatech, it's a very tight partnership.
The team at Zoolatech is incredibly collaborative, and we work as a team despite being thousands of miles away from each other.”
Spencer Rascoff
CEO Match Group
5/5
“Zoolatech has been a key technology partner for Pandora,
enhancing our software development and deployment capabilities. They're ambitious, supportive, fast-moving, and well-skilled, with sound ethical values.”
Erika Romsics
Contract and Vendor Manager, Pandora
erica
5/5
“The apps they’ve developed give us the opportunity to get more customers.
We’re providing more services to target big customers. We can install jobs faster and identify reduce bottlenecks, so we’re providing a better customer experience.”
Aida Youssef
Senior Director of Software Engineering, Complete Solaria
5/5
“Zoolatech has access to a deep talent pool and knows how to identify client's needs.
With the help of Zoolatech, went from a very early and incomplete prototype to the MVP release, the first production release, and the first paying customer!”
Greg Wagenhoffer
CEO, GreenVisr
5/5
“Zoolatech enabled us to build a world-class engineering team quickly and efficiently.
Zoolatech's pre-screening process and engineer training are customized for providing effective engineers that can contribute immediately to accelerating product roadmaps.”
Shariq Minhas
CTO, SVSG
5/5
“We can recommend Zoolatech
for their talent pool, attention, ability to understand our requirements, candidate screening process and constant communication.”
Chaitanya Pallapothula
SVP, Tailored Brands, Inc.
5/5
“Zoolatech’s developers quickly became an integral part of our team effort
with whom we shared daily stand up calls. Overall, Zoolatech fit well with our needs for agile development and continued to adapt as our needs evolved.”
Forrest Glick
UX Designer, Stanford University
5/5
“Working with Zoolatech has been a driving force in our business offerings.
The team utilizes it's experience and expertise meshing with our internal team creating a positive work environment. Zoolatech is by far one of the best teams to work with in the industry.”
Kris Naidu
CEO, Zeacon
Kris Naidu CEO, Zeacon
5/5
Data Observability Stack

Tools We Work With

The tools named here cover monitoring, alert routing, lineage, orchestration, streaming, storage, and reporting.
Apache Airflow
Apache Airflow
Apache Spark
Apache Spark
Apache Kafka
Apache Kafka
OpenLineage
OpenLineage
Python
Python
PostgreSQL
PostgreSQL
Datadog
Datadog
Databricks
Databricks
Google BigQuery
Google BigQuery
PagerDuty
PagerDuty
Looker
Looker
AWS
AWS
Microsoft Azure
Microsoft Azure
and others

Scope Your First Phase

Share your sources and critical pipelines. We outline what coverage would take.
Pricing Factors

What Drives the Cost

Know which choices move your budget before you scope.
Data volume

Scale of what you watch

  • Number of tables and datasets under monitoring
  • Daily record counts across critical data pipelines
  • Retention period for check history and alerts
Source variety

More sources, more checks

  • Mix of databases, SaaS exports, files, and streams
  • Formats that need custom parsing before checks run
  • Third-party feeds that change without notice
Critical pipelines

Coverage where it matters

  • Data pipelines tied to revenue, finance, or compliance
  • Datasets that need column-level rather than table-level checks
  • Pipelines feeding models or customer-facing products
Lineage depth

How far tracing goes

  • Table-level versus column-level data lineage
  • Lineage across warehouses, BI tools, and ML features
  • Jobs that need custom instrumentation to emit lineage
Response time

How fast someone answers

  • Business-hours triage versus round-the-clock coverage
  • Severity levels that require an immediate human response
  • Data SLOs tied to contractual SLA terms
Ongoing operations

What happens after go-live

  • Clean handover versus continued managed operations
  • Expected growth in datasets, sources, and consumers
  • Threshold tuning as seasonal data patterns shift
Why Choose Us

Why Businesses Trust Us

logo
At Zoolatech, we create engineering teams for industry leaders across the US and Europe — teams that move fast, think big, and deliver strong impact.
96%
Client Satisfaction
300+
Successful Projects
2017
Year Founded
98%
Retention Rate
team sport photo
At Zoolatech, we create engineering teams for industry leaders across the US and Europe — teams that move fast, think big, and deliver strong impact.
Engineering Excellence. Every Time.
main award png (1)
At Zoolatech, we create engineering teams for industry leaders across the US and Europe — teams that move fast, think big, and deliver strong impact.
team sport photo
600+
Employees
Headquarters
USA
Development Centers
PL
UA
MX
TR

Start With One Pipeline

Name the dataset your teams trust least. We show what catching its next failure takes.
Contact Sales
Frequently Asked Questions

How is data observability different from infrastructure observability?

Infrastructure observability tracks hosts and services with tools such as Prometheus, Grafana, and APM, while data observability tracks the data itself: data freshness, volume, schema drift, distribution, and lineage. Zoolatech covers the infrastructure side through infrastructure observability work. Our data observability implementation guide explains how to put these checks into practice.

Do we need to buy a data observability platform to work with you?

No, the work runs on the platform you already license, on an open stack, or on a hybrid of both, and existing data quality tests are reused rather than rebuilt. Typical building blocks include OpenLineage, Apache Airflow, and Apache Spark on Snowflake, Databricks, or BigQuery.

How long before we see results?

The first measurable result is a ranked inventory of your critical data pipelines and their coverage gaps, delivered at the end of discovery. Timing for each later step depends on source count and lineage depth and is fixed in the statement of work.

Who owns the code, the alert definitions, and the documentation?

You do, from the first commit, because every repository lives in your organization. Handover adds runbooks, alerts as code, architecture documentation, an access inventory, and a known-limitations list, so ending an engagement never means rebuilding monitoring.

How do you keep alerts from becoming noise?

Thresholds are set from your historical data rather than defaults, alerts are versioned as code, and each one has a named owner and escalation path. Centralized alerting built this way helped a US consumer-finance marketplace reduce MTTA and MTTR across critical services.

What engagement models do you offer, and how is pricing structured?

The four models are data observability consulting, team extension on time and materials, fixed-scope implementation at a fixed price, and managed operations through managed delivery. Pricing follows data volume, source variety, the number of critical pipelines, lineage depth, required response time, and whether operations continue after launch.

Who offers the best data observability services?
There is no single best provider, because the right fit depends on whether you need a platform, an implementation partner, or an operating team. Zoolatech is an engineering partner that designs and implements data observability on tools you own, hands over repositories, runbooks, and alert definitions, and sells no monitoring product.

Who provides managed data observability services?

Managed data observability means a partner runs monitoring, triage, and incident response for you after implementation, and Zoolatech offers it as one of four engagement models. Ownership of code and alert definitions stays with you throughout, including when operations run through offshore and nearshore delivery.

What are the most reliable data observability services?

Reliability comes from anomaly detection and alerts tuned to your data rather than defaults, data lineage that shows downstream impact, and a documented escalation path backed by data SLOs and clear SLA terms. Ask any provider to show all three on your own pipelines before signing.

Should we build data observability in-house, buy a platform, or hire a partner?

Build in-house when monitoring is core to your product, buy a platform when detection is the main gap, and hire a partner when you want the practice to stay yours after the engagement ends. Buying alone solves detection but not root cause, because a platform shows the symptom while lineage and runbooks find the cause.